
Source
The bending magnet is a photon source for the beamline. The Figure 1 shows radiation peak flux density as a function of the photon energy emitted from the source.
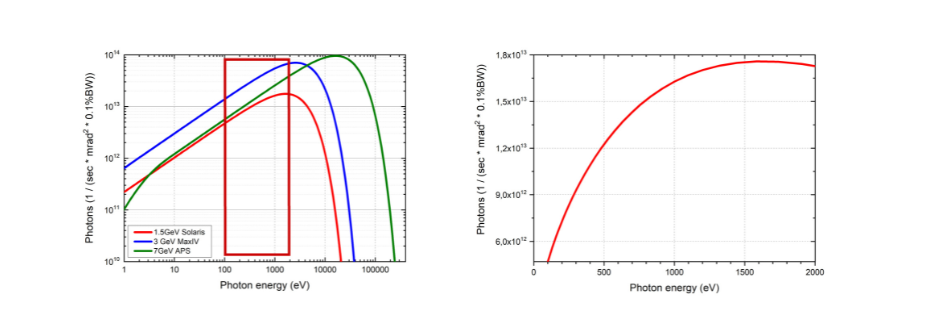
Figure 1. (left graph) Flux density from the bending magnet of different synchrotron sources (Solaris, MaxIV, APS). The frame marks symbolically the available energy range at the PIRX beamline. (right graph) A close-up of the photon flux density emitted from the Solaris bending magnet in the energy range of 100-2000 eV.
| Parameter | Value |
|---|---|
| Electron energy (GeV) | 1.5 |
| Critical energy (keV) | 1.96 |
| Magnetic field (T) | 1.309 |
| Bending radius (m) | 3.822 |
| Total integrated power (W/mrad) | 9.32 |
| Vertical source size (μm) | 30 (σ) |
| Horizontal source size (μm) | 44 (σ) |
Table 1: The Solaris bending magnet source parameters.
Optics
The first slits select the central cone of radiation. The beam profile delivered to the beamline (upstream M1) is presented on Figure 2.
Horizontally beamline optics accept 1,5 mrad and vertically 1 mrad, which correspond to 14 mm and 9 mm of the presented profile scans, respectively.
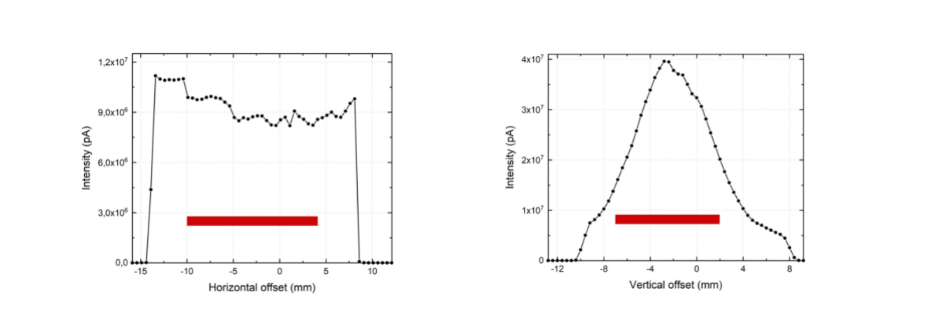
Figure 2. Beam profile of the radiation cone delivered to the beamline (left) horizontal, (right) vertical. Red lines represent beamline optics acceptance.
The beamline contains a number of optical elements (mirrors and diffraction gratings (see Table 2 and Figure 3)) and a number of apertures that limit and define the cone of synchrotron radiation.
Figure 3. Beamline layout.
| Feature | Unit | M1(CM) | M2(PM) | GR1 | GR2 | M3(FM) | M4(RFM) |
|---|---|---|---|---|---|---|---|
| Shape | Toroidal | Plane | Plane | Plane | Cylindrical | Toroidal | |
| Function | Collimating | - | - | - | Focusing | Refocusing | |
| Position | [m] | 10 | 13.1 | 13.4 | 13.4 | 15 | 24.9 |
| Source distance h/v | [m] | 10/10 | - | - | - | -/∞ | 2.4/2.4 |
| Image distance h/v | [m] | 12.5/∞ | - | - | - | -/7.5 | 1.6/1.6 |
| Total deflection angle | [°] | 176 | 169-180 | 169-180 | 169-180 | 176 | 177 |
| Optical/geometrical surface size | [mm] |
430 x 20 /480 x 40 |
380 x 30 /400 x 40 |
190 x 30 /200 x 40 |
190 x 30 /200 x 40 |
300 x 30 /320 x 40 |
120 x 20 /150 x 26 |
| Bulk material | Si | Si | Si | Si | Si | Si | |
| Binding layer / coating | Cr / Au | Cr / Au | Cr / Au | Cr / Au | Cr / Au | Cr / Au | |
| Tangential radius | [mm] | 318 112 | - | - | - | - | 73 512 |
| Sagittal radius | [mm] | 699.4 | - | - | - | 524.2 | 50.28 |
| Tangential slope error | [ μrad ] | 1.01 | 0.50 | 1.1 | 0.7 | 0.89 | 0.99 |
| Sagittal slope error | [ μrad ] | 4.24 | 1.81 | 0.7 | 0.7 | 2.14 | 7.26 |
| Line density | - | - | 800 | 1 600 | - | - | |
| Groove width to period ratio | - | - | 0.64 | 0.68 | - | - |
Table 2. Beamline optical elements parameters.
The collimating mirror (CM) is a toroid which converts the divergent beam from the source into the beam collimated in the vertical (dispersive) plane. It accepts 1.5 mrad radiation cone from source in horizontal direction. The CM also focuses the beam horizontally at the exit slit (ES). Due to radiation safety this element is enclosed in a hutch with led walls. The chosen optical design is based on a plane grating monochromator working in the collimated light (cPGM). This optical geometry allows optimization over a wide energy range for high flux and/or high resolution by operating at variable Cff parameters.
The photon beam is focused vertically at the exit slits by a cylindrical mirror – FM. The monochromatic source at the exit slits is refocused at the sample position by a toroidal mirror – RM with a demagnification factor 1.5:1.
Currently there are two gratings installed at the cPGM: with 800 and 1600 lines/mm, both with laminar profile.
It will be possible to build another branch into this beamline by inserting an additional focusing optics. The other branch will have its own permanent exit slit and refocusing mirror.
The photon beam parameters were characterized by ionization effect in a gas cell using multiple gases (Ar, N2 and Ne). The summary of the energy resolution vs exit slits opening are presented at Figure 4. We may conclude that we have reached the calculated value for resolving power (RP), which is 4000 and more.
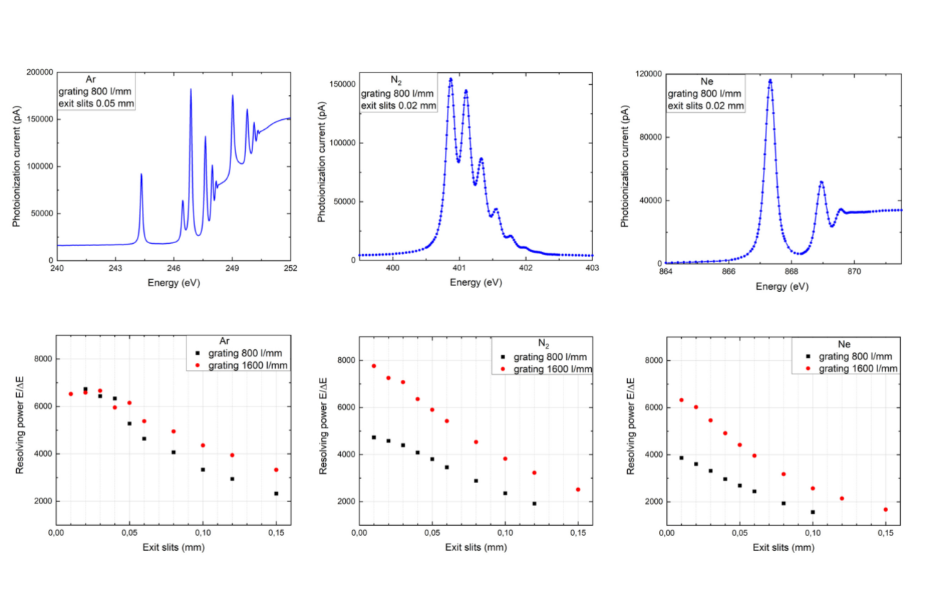
Figure 4. (top row) Three experimental X-ray absorption spectra of gases: from left at the Ar K-edge, N2 K-edge and Ne K-edge. (bottom row) The resolving power as a function of an exit slit opening for three gasses, obtained by fitting the measured spectra.
The total flux at sample position was measured using AXUV photodiode (see Figure 5). Due to 176° total deflection angle at CM and FM there is characteristic decrease of intensity at high energy photon range respect to the spectrum from the source.

Figure 5. The experimental flux curves measured on the photodiode with 400 mA current in the storage ring (SR) at the sample position with 0.050 mm exit slits opening for two gratings with flux-optimal Cff values, grating 800 l/mm (black) and 1600 l/mm (red), respectively. The inset are zooms at energy range close to the carbon and oxygen K-edge. The SR operates in decay mode usually with current in range 450-300 mA.