
Web Content Display Web Content Display

Highlights

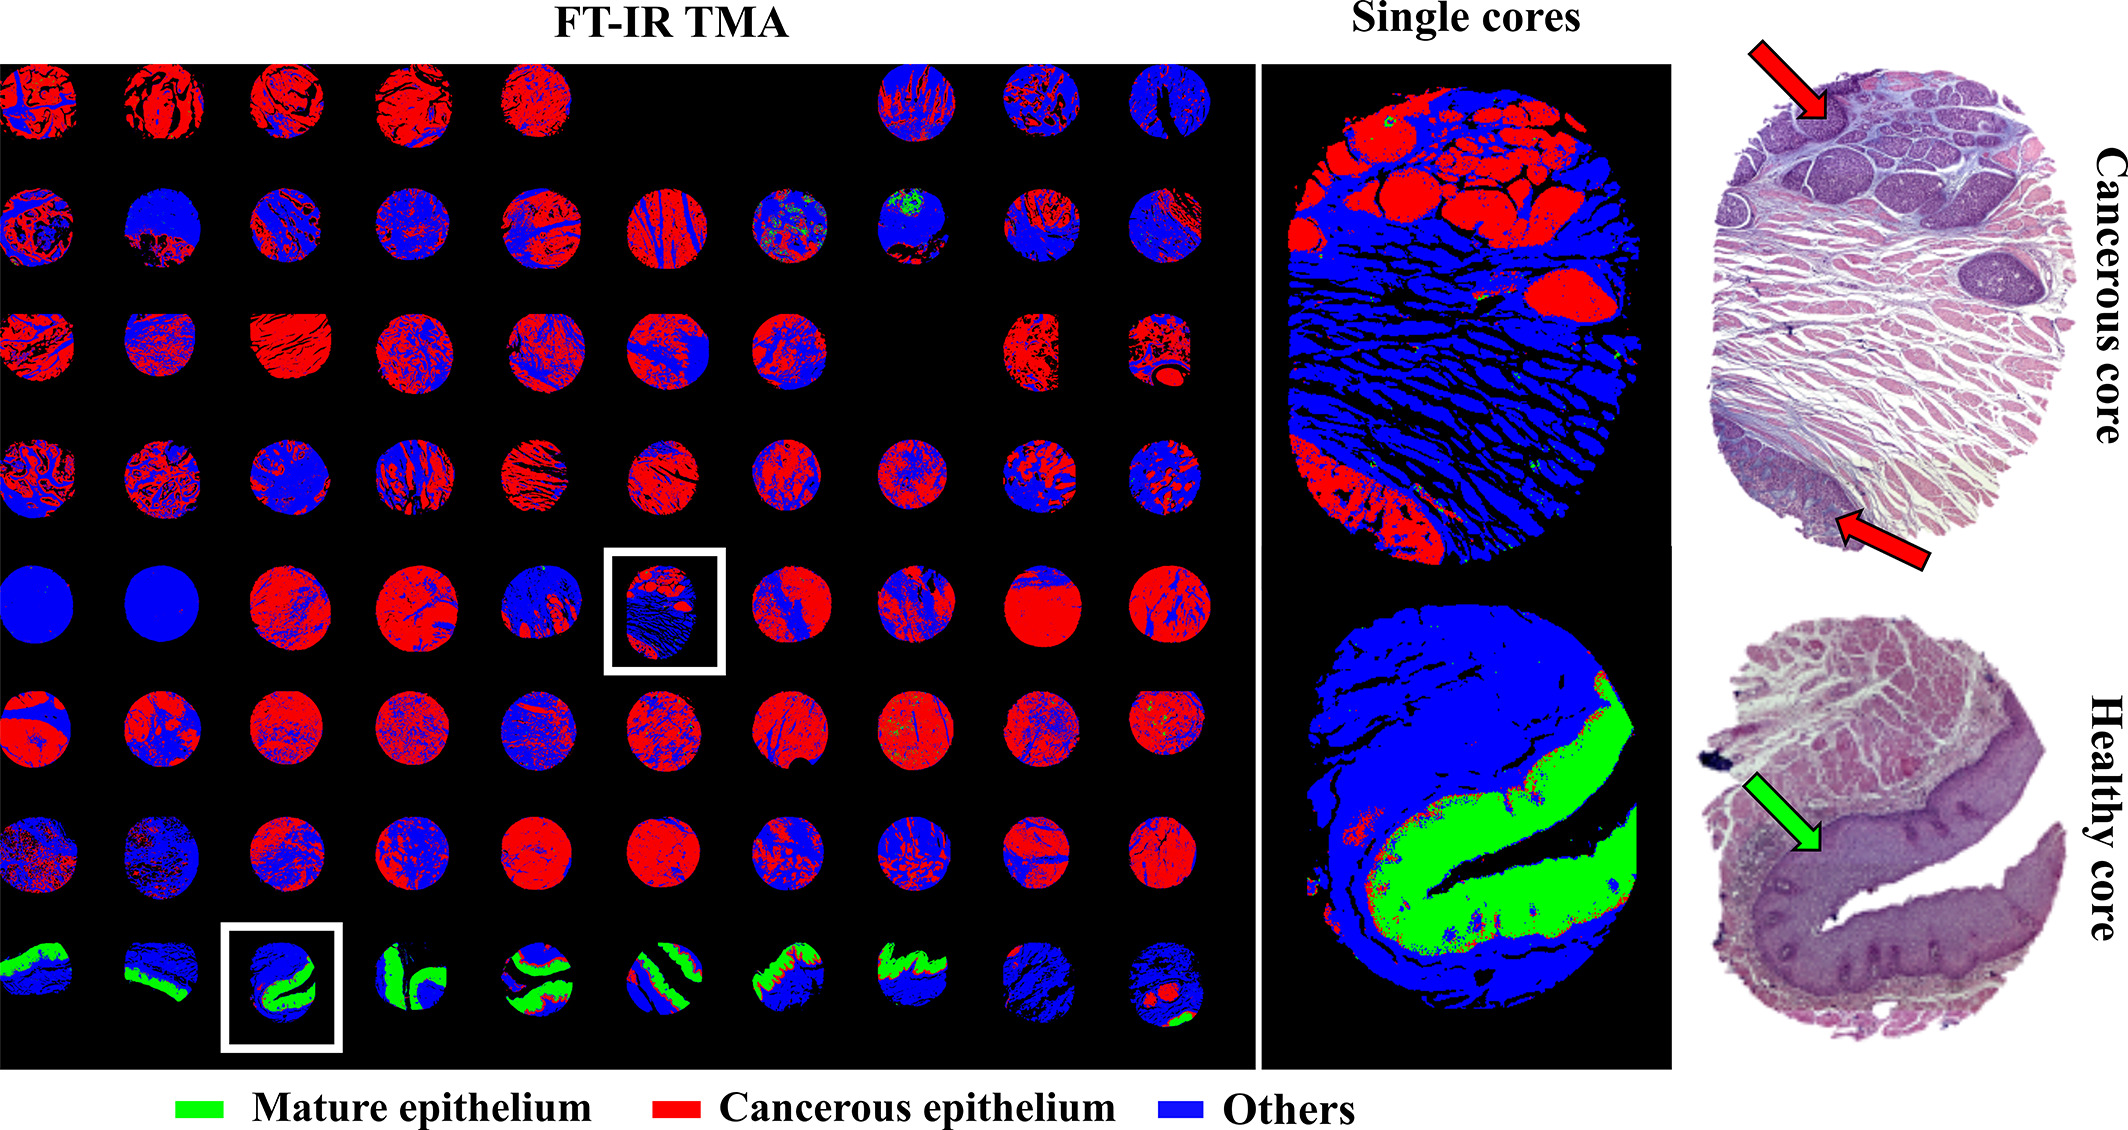
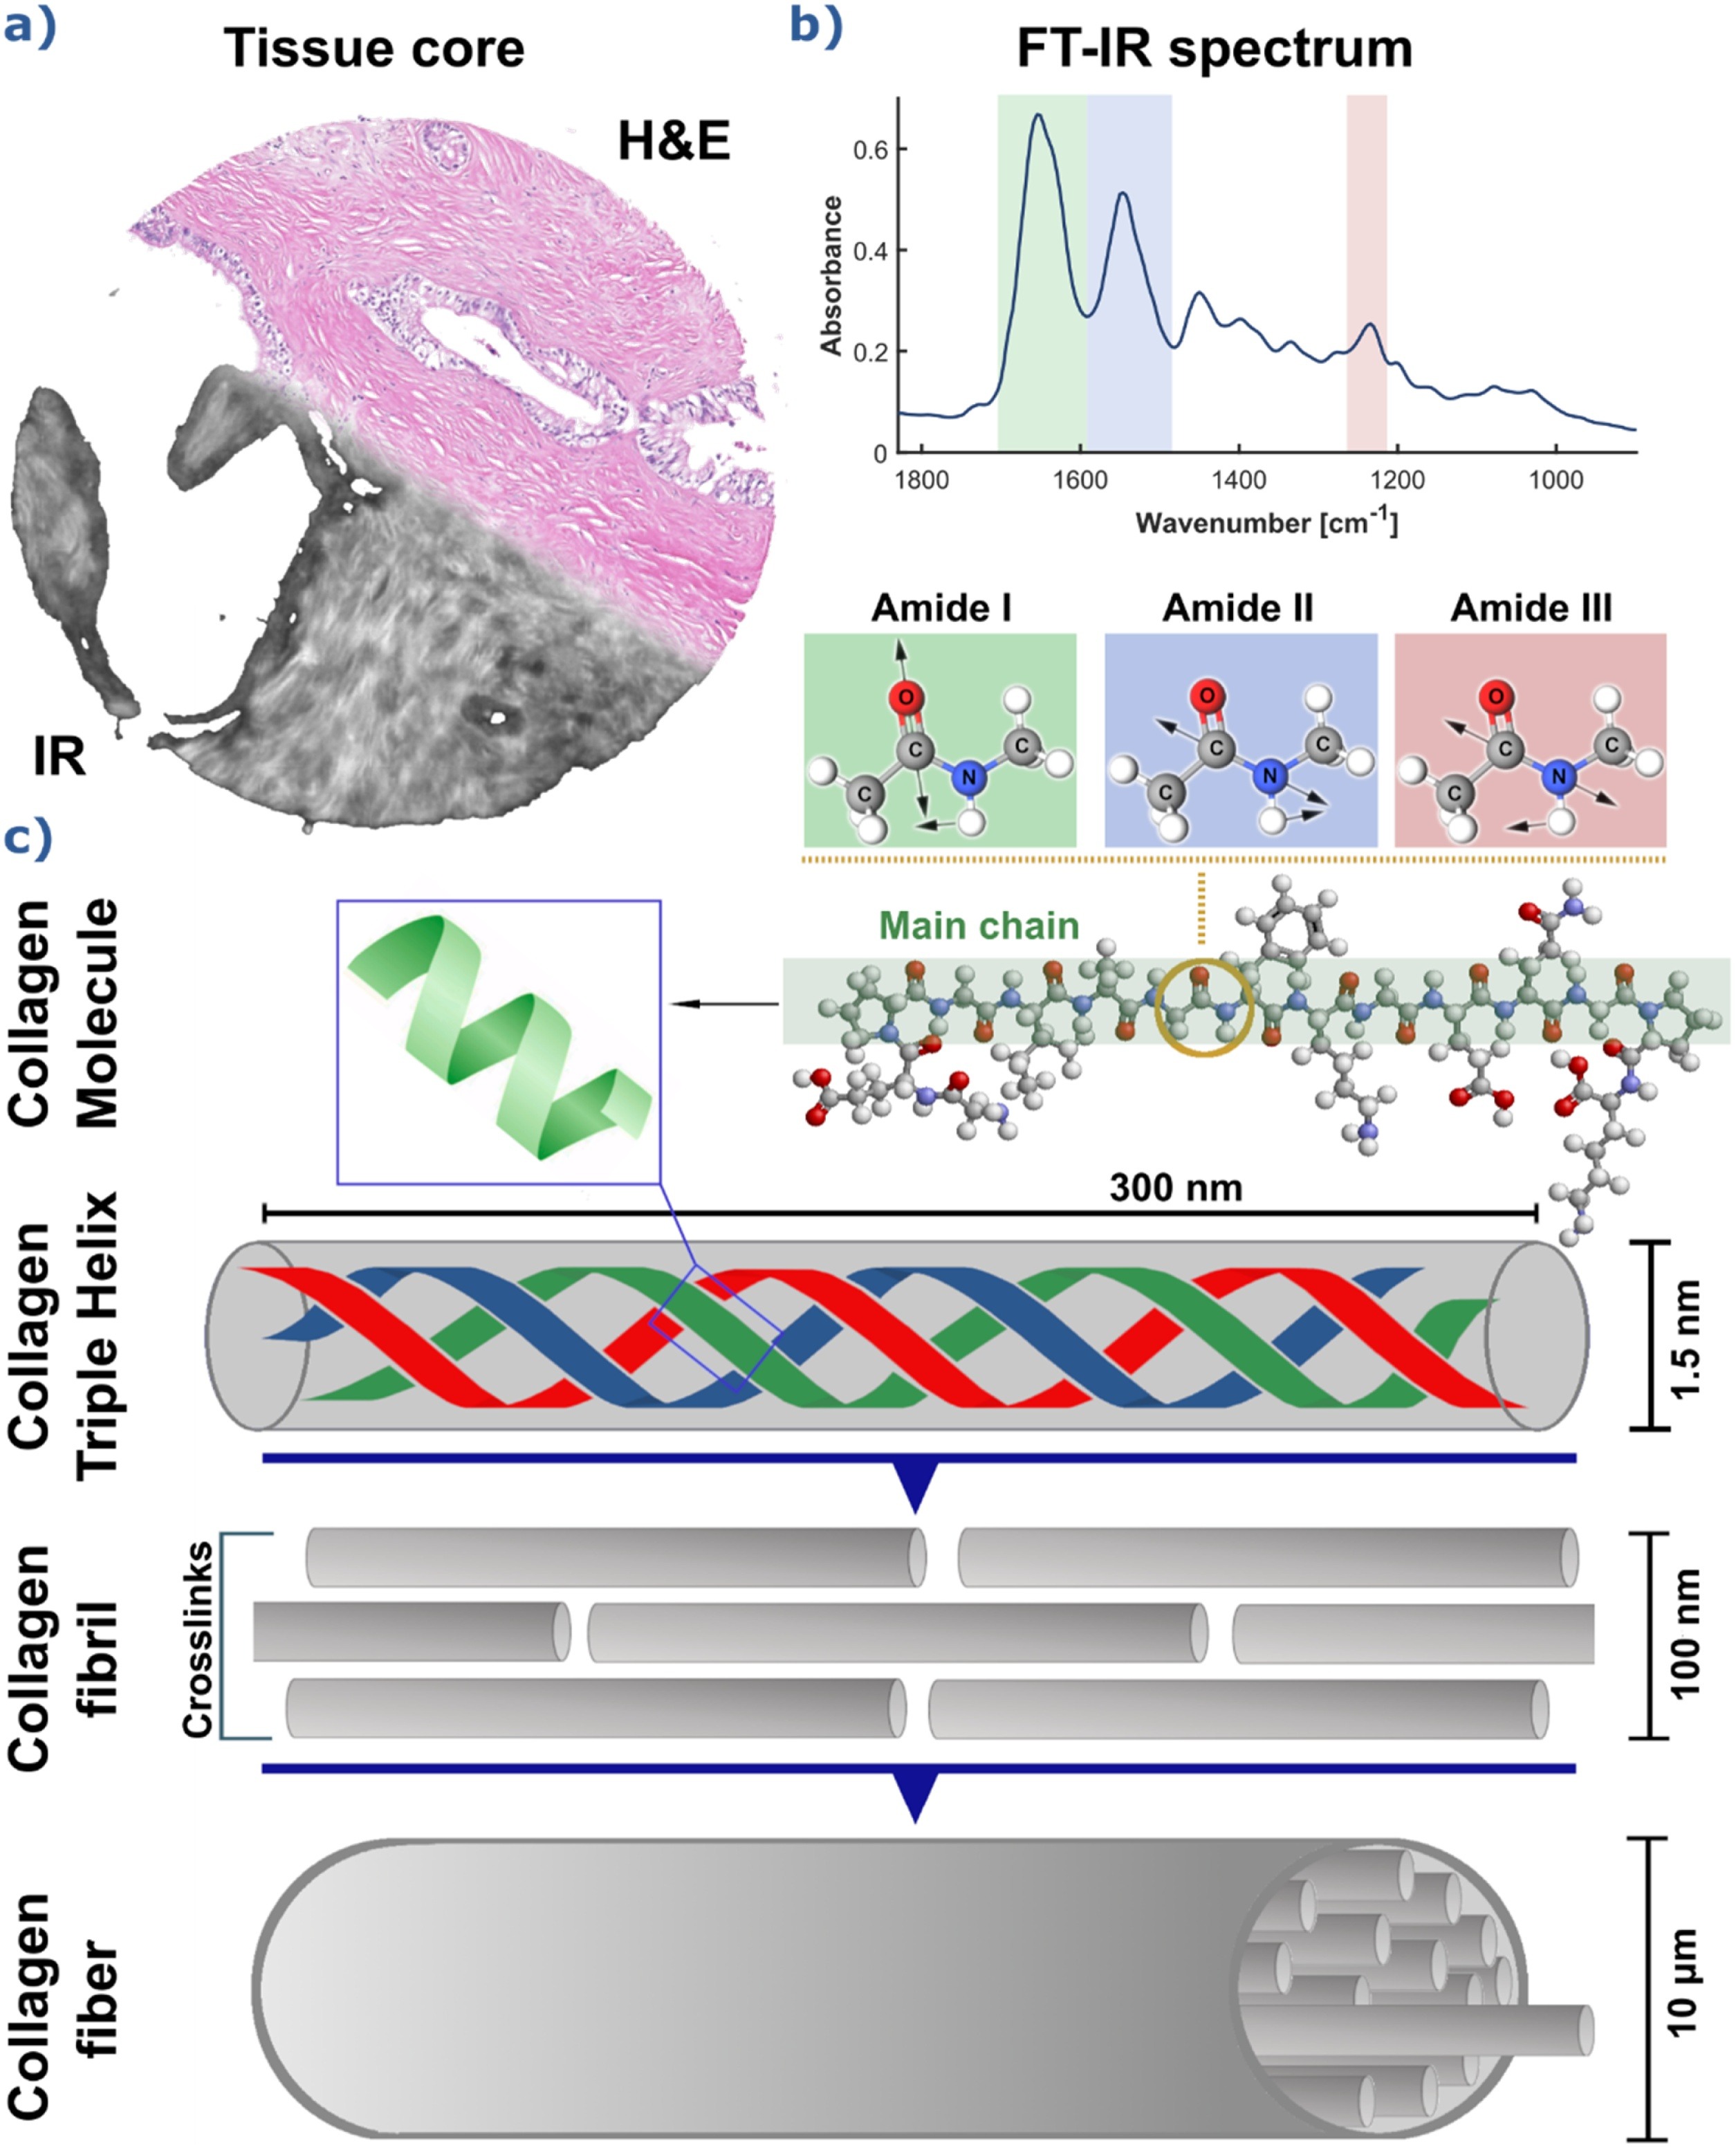
Tissue classification – FT-IR microscopy and machine learning

Infrared chemical imaging is a powerful technique in biomedicine and can be employed as an additional diagnostic tool in cancer medicine and others. 
Very interesting is the possibility of automating the process of biopsy composition classification. The figure below shows the array prediction of esophageal tissue needle biopsy results of cross-validation using the random forest classifier.
Rysunek 1. Predykcja na macierz biopsji przełyku: dojrzały nabłonek, nabłonek zmieniony rakowa oraz inne elementy tkankowe. Macierz została zmierzona w trybie transmisji. Wygenerowane dzięki klasyfikatorowi obrazy biopsji zgadzają się ze zdjęciami spod mikroskopu optycznego wybarwionych biopsji (H&E)
Figure 1. Results of five-fold cross-validation (CV) prediction of three tissue classes: mature epithelium, cancerous epithelium, and others for esophagus dewaxed TMA measured with FT-IR system in transmission mode (left figure panel). Single cancerous and healthy biopsies predicted images with corresponding H&E stained biopsies images (right panels). Link. 

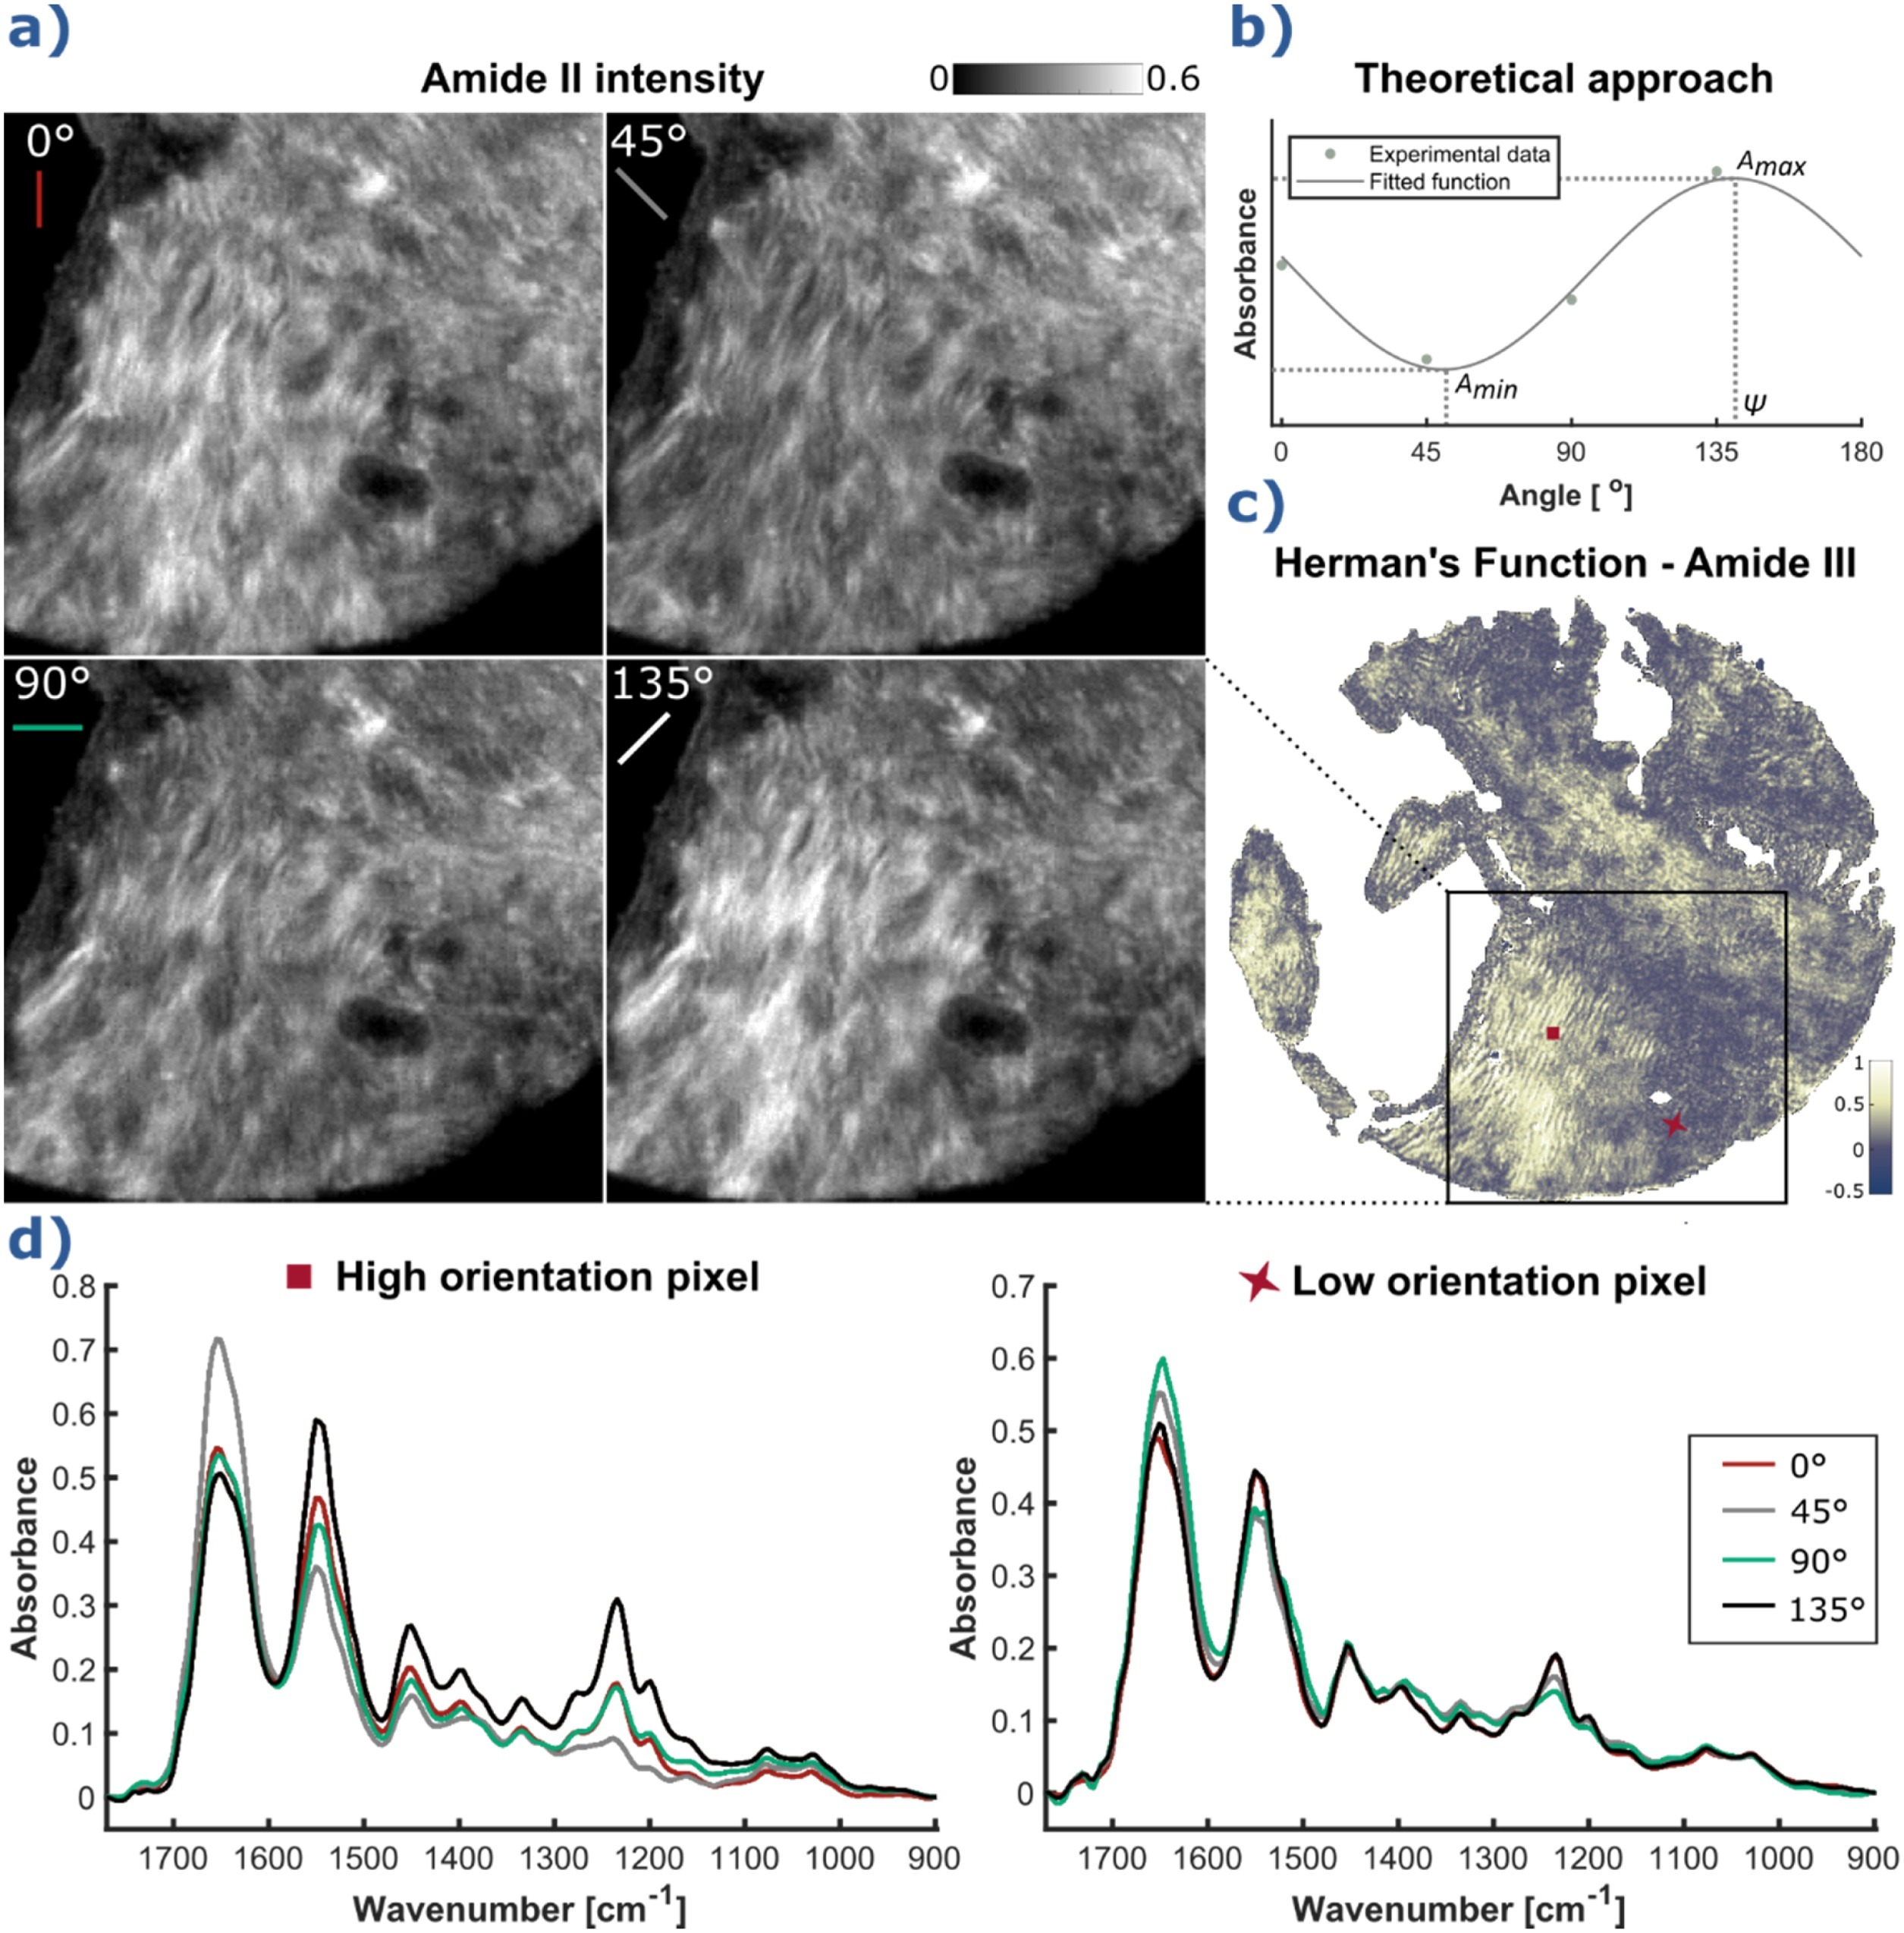
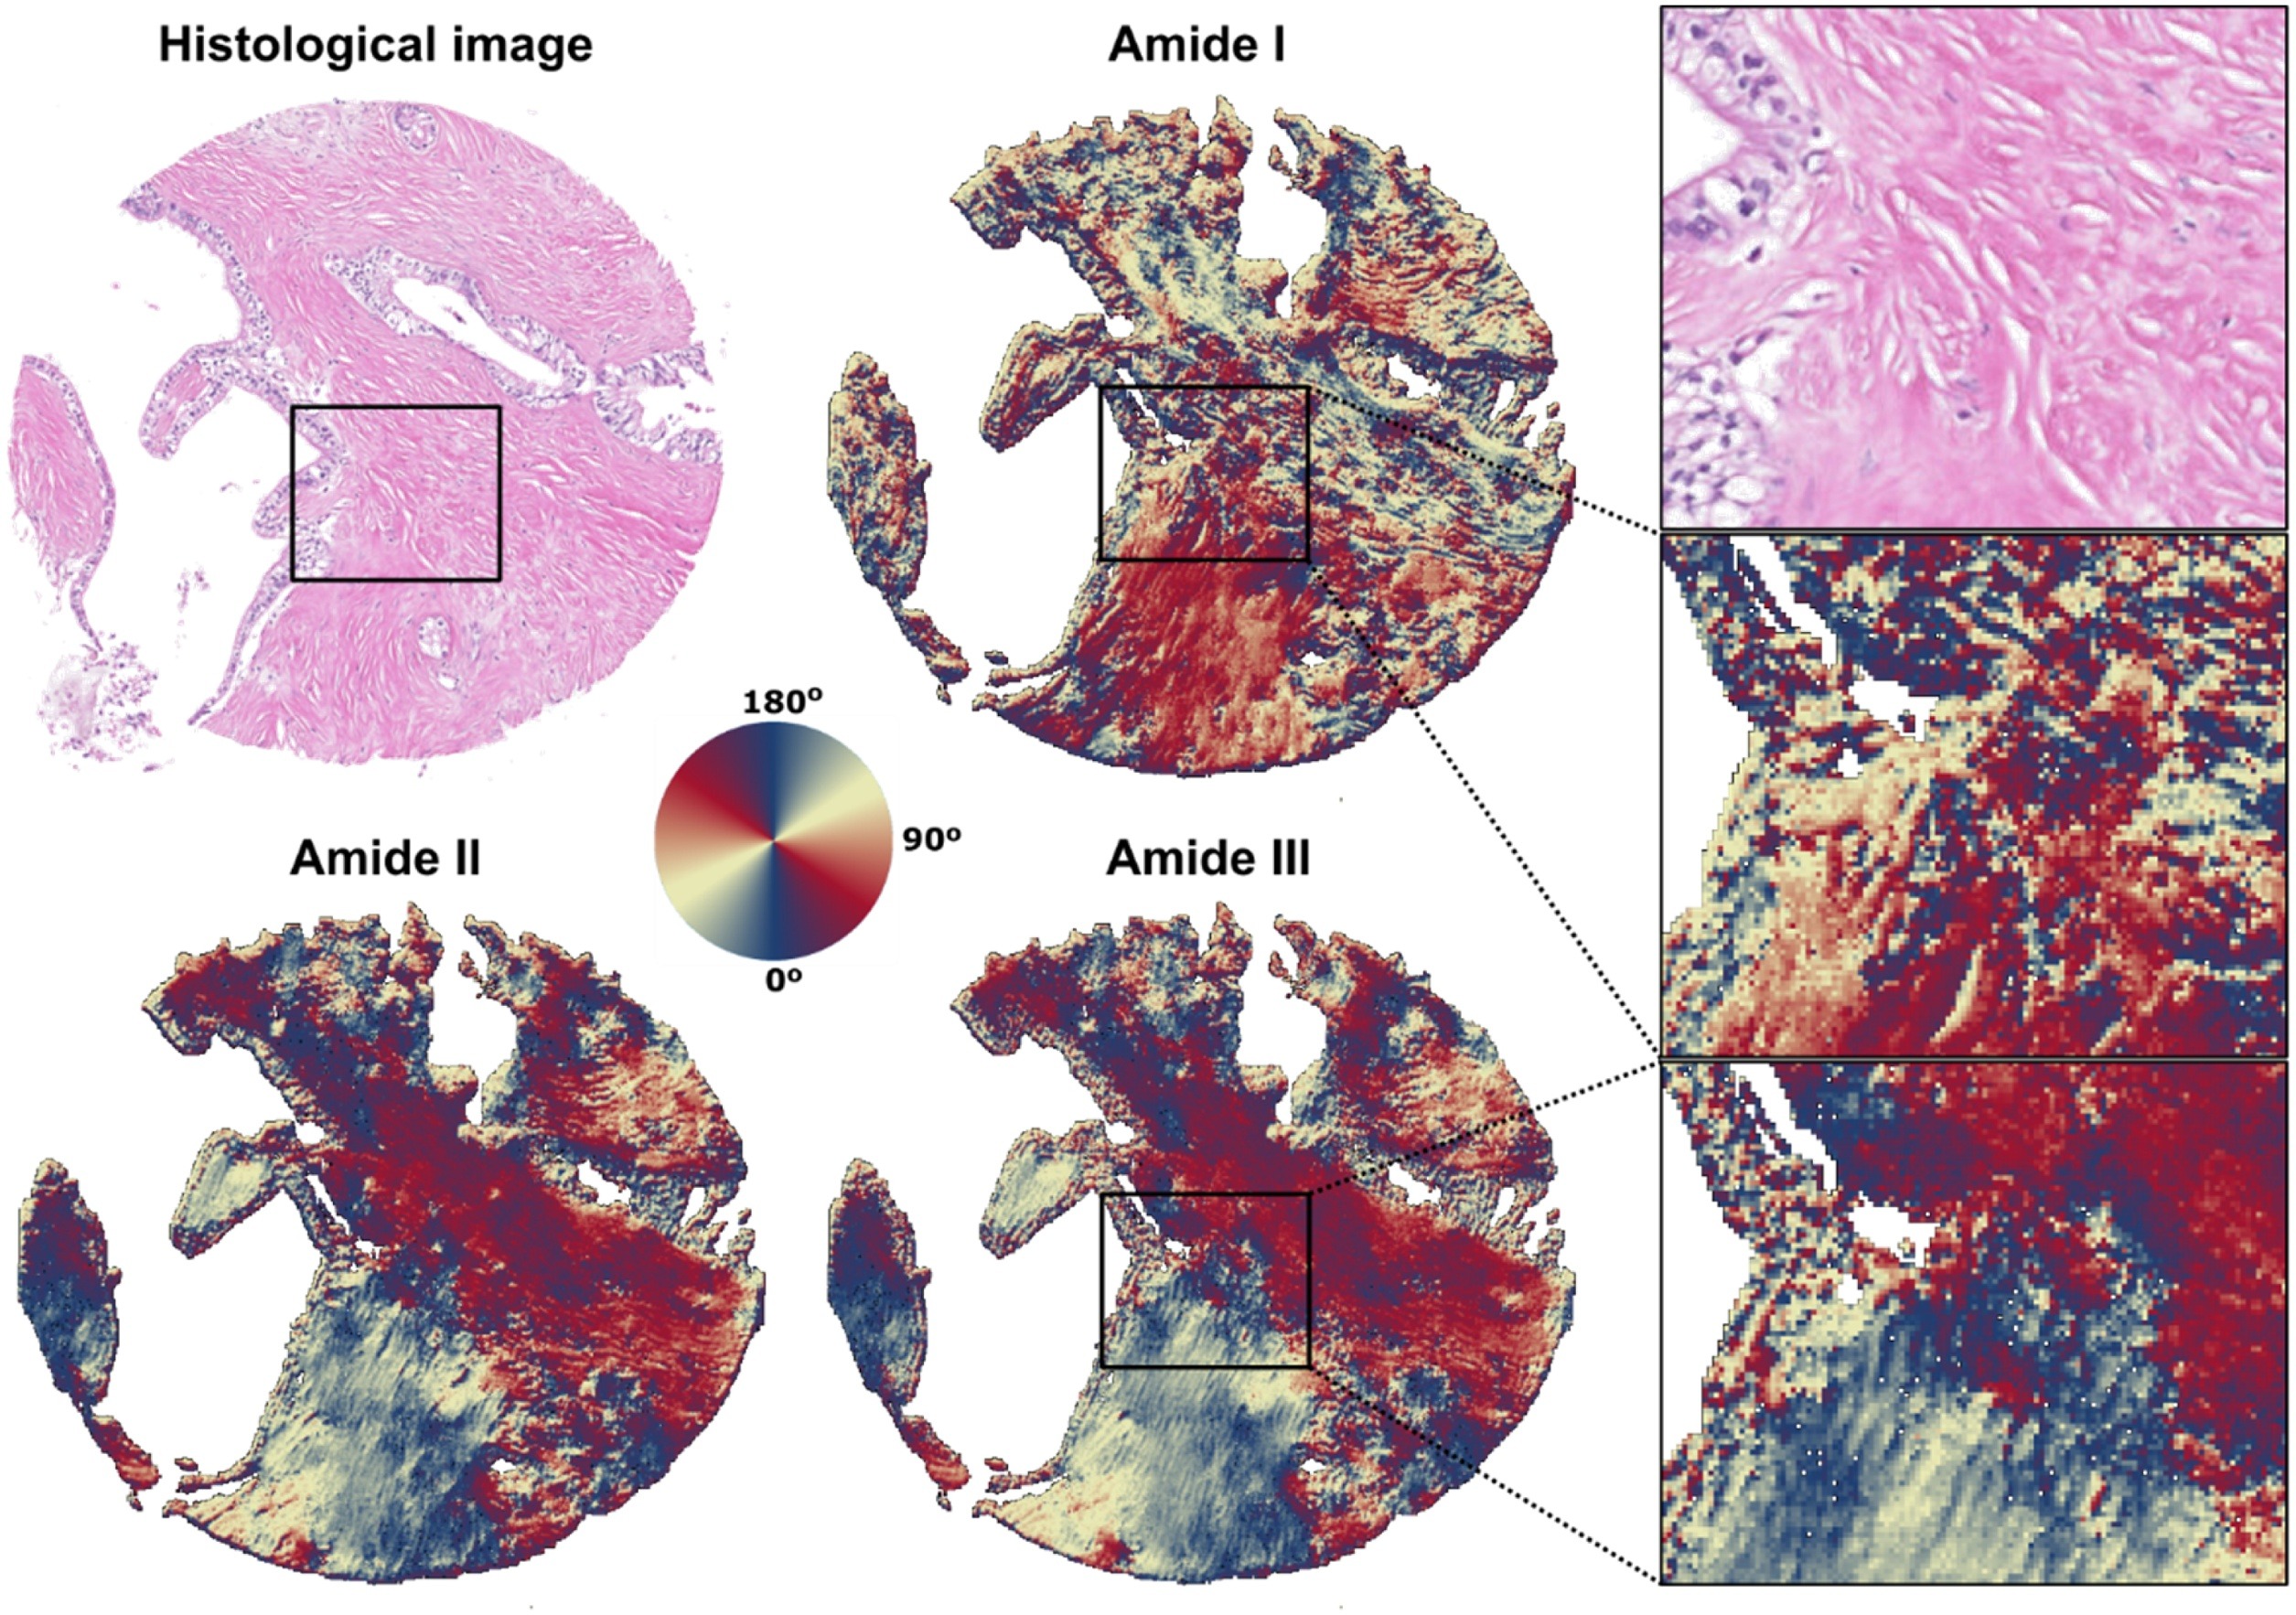
In-plane macromolecules orientation in biopsy

The linear and circular polarization of infrared radiation provides us with another type of information, next to the image and chemical information, it is the order in the material - both its degree and the organization of molecules.
The combination of advanced imaging methods and linear polarization of light allows us to determine the orientation of macromolecules in two- and even three-dimensional space. The development of a method used for decades in material science with two perpendicular polarization was done with an addition of another two polarization angles. The “four-polarizations” method (4P) allows the fitting of a sinusoidal function and precise determination of the direction of molecules' vibrations.
 
Rysunek 2. Obrazy wygenerowane dla intensywności pasma amidu II z użyciem czterech różnych kątów polaryzacji (a), teoretyczne ujęcie zależności absorbancji od kąta polaryzacji liniowej (b), funkcja Hermansa (stopień uporządkowania) dla amidu III, widma spektralne obszaru o dużym i małym stopniu uporządkowania (d).
Figure 2. Intensity images of amide II absorbance under different polarizations. Theoretical presentation of absorbance dependence from polarization. Hermans function image for amide III, spectra of areas with a high and low level of organization. 
 
The “four polarization” method was applied by our team for studying the orientation of collagen fibers in biopsy in the microenvironment of cancer. 
Rysunek 3. Zdjęcie spod mikroskopu optycznego wybarwionej biopsji igłowej trzustki (H&E) oraz orientacje obliczone dla trzech pasm amidowych (drganie amidu II i III jest równoległe do głównego łańcucha kolagenu, a amidu I prostopadłe).
Figure 3. Optical microscope image of the stained (H&E)  pancreatic biopsy and the orientations calculated for the three amide bands (vibrations of amide II and III are parallel to the main collagen chain, and amide I is perpendicular). First link. Second link.
 

Orientation of molecules in the polymer in three-dimensional space (3D)

Simultaneous analysis of two near-orthogonal vibrations allows determining the orientation of molecules in three-dimensional space using the “four-polarizations” method. The measurement set-up itself does not change, as shown in the figure below. It is still a system of two polarizers when measuring in transmission mode and one polarizer when measuring a sample in transflection or transmission mode. The mathematical approach to the problem of determining the orientation of molecules in 3D space is extended.
Rysunek 4. Układ mikroskopowy do mierzenia próbki z użyciem czterech różnych polaryzatorów (a), teoretyczne przedstawienie zagadnienia (b-e).
Figure 4. Schematic drawing of polarized FT-IR experimental setup including absorbance dependence of a molecule from the orientation of incident polarization and theoretical approach.  
 
Our team as the first in the world applied the “four-polarizations” method for simultaneous analysis of two bands' orientations. We successfully obtained information about the three-dimensional orientation of molecules in highly oriented polycaprolactone (PCL) film.  
Rysunek 5. Wyniki obliczeń orientacji 3D pierwszego momentu przejścia, równoległego do głównej osi molekuły (a) polimeru oraz drugiego, prostopadłego (b). Wyniki pomiarów dla mikroskopii FT-IR oraz O-PTIR.
Figure 5. Visualization of the primary (a) and secondary (b) transition moment orientation calculated for FT-IR, O-PTIR, and Raman. To compare FT-IR and O-PTIR results, O-PTIR data were binned (13 × 13 pixels) to yield a similar pixel size as FT-IR.  Link.

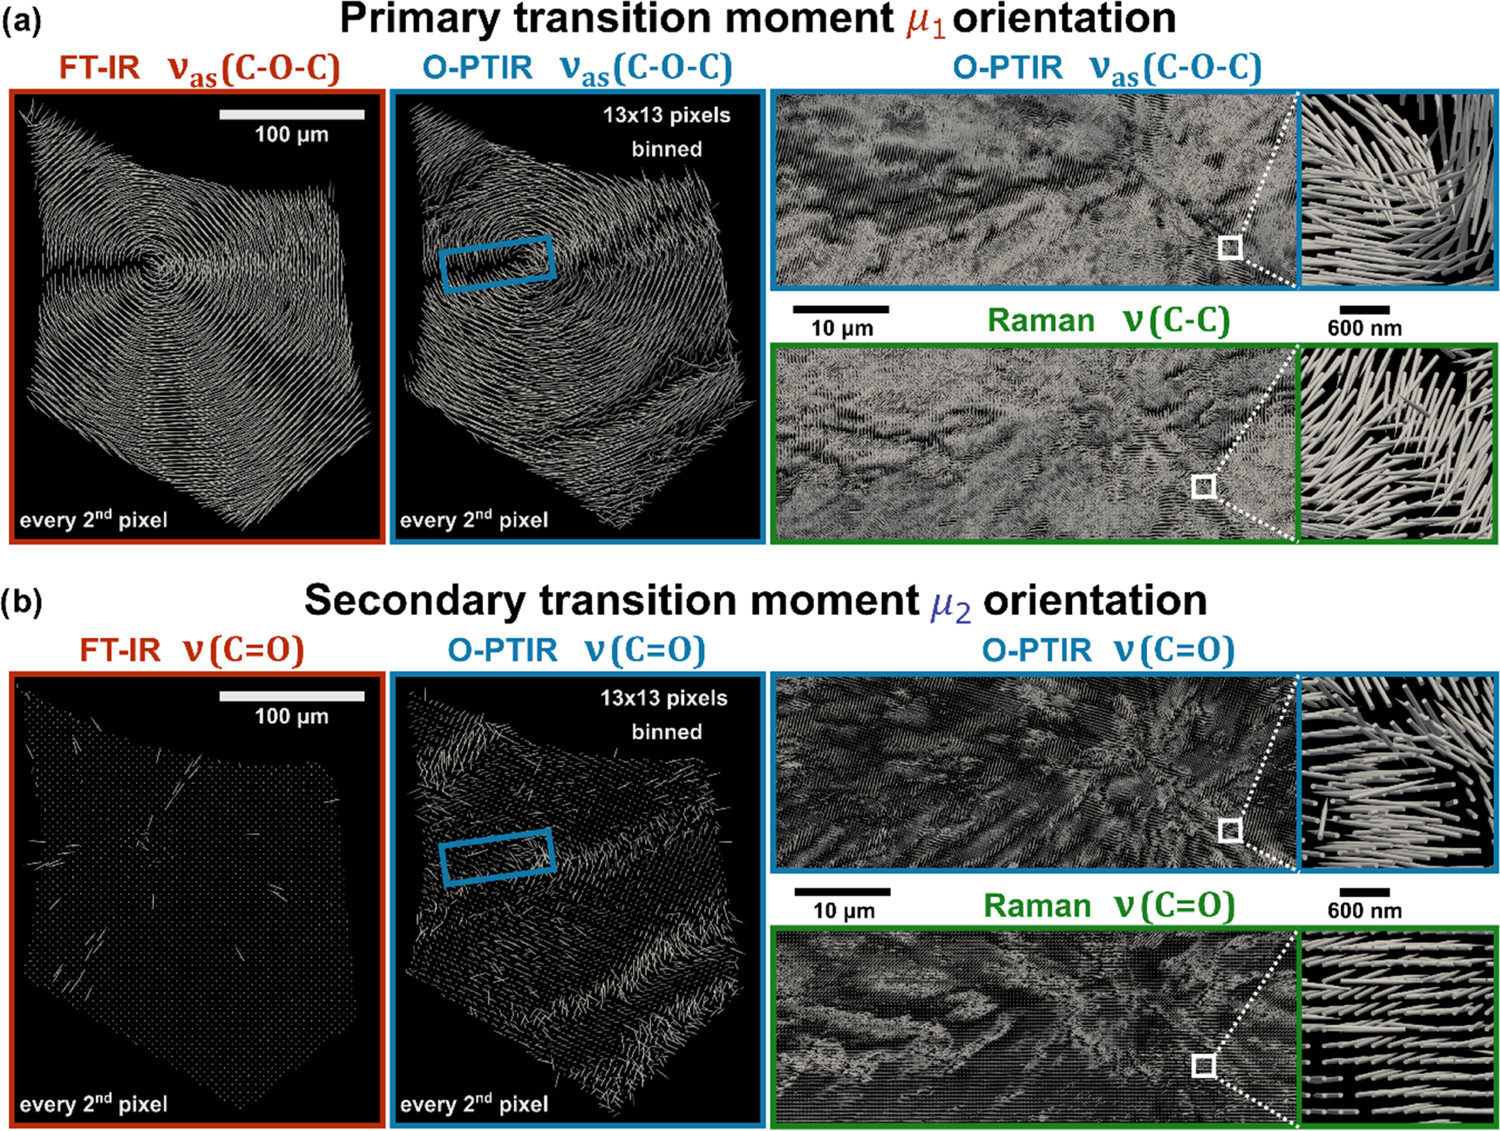
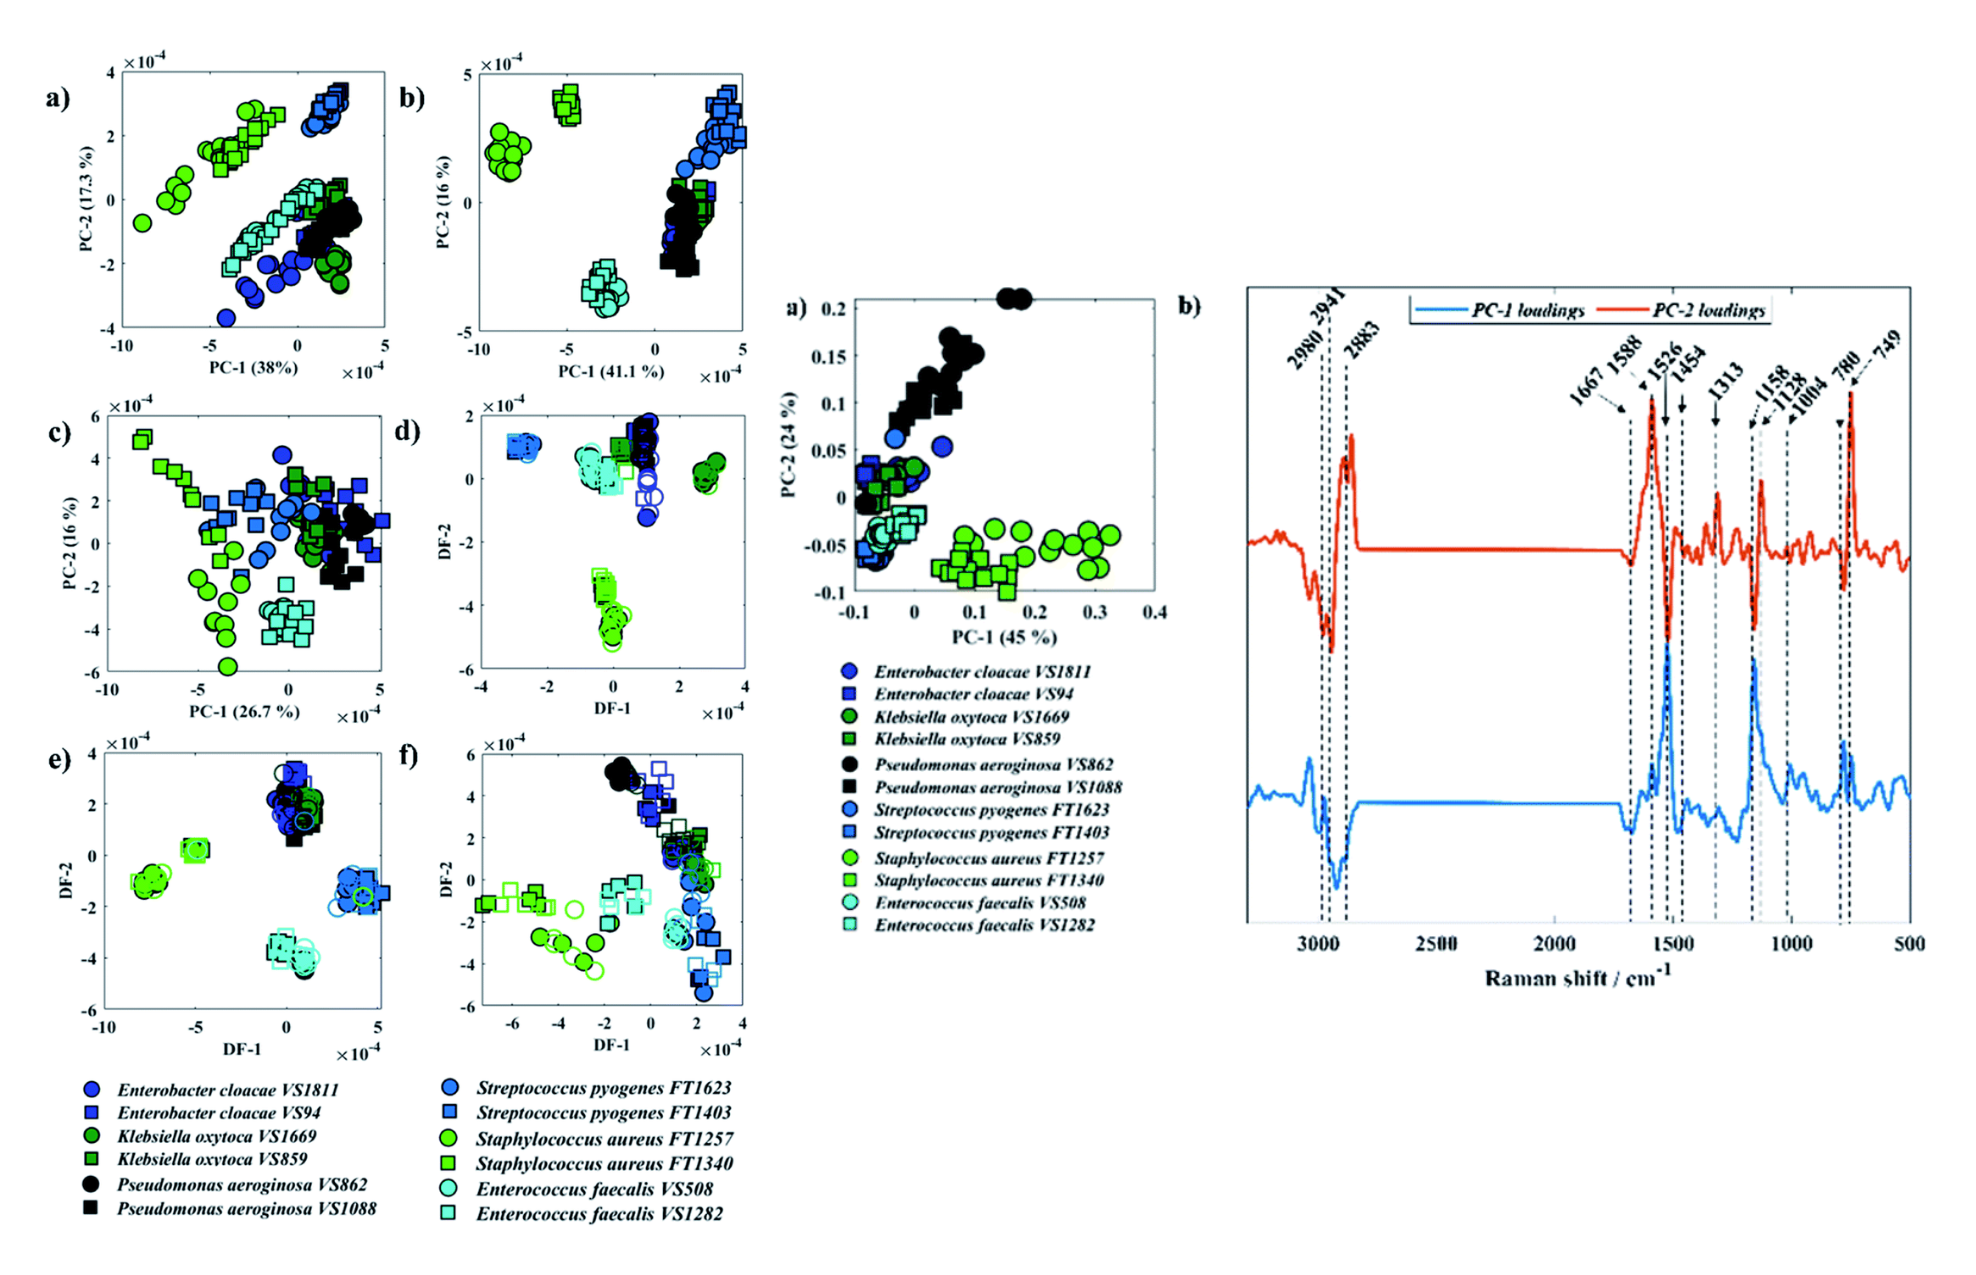
Simultaneous spectroscopies O-PTIR and Raman

As presented above, the “four-polarizations” method can be successfully used in O-PTIR microscopy, which allows for obtaining results with several times better spatial resolution. 
The O-PTIR method, besides obtaining an image and spectrum with spatial resolution in the range of several hundred micrometers, also allows for the simultaneous generation of the IR and Raman spectra with the use of a green 532 nm laser. The physical basis of FT-IR and Raman spectroscopy are completely different, making them two complementary methods that together allow obtaining much deeper and more complete information about the material than alone. Raman spectroscopy uses the phenomenon of inelastic light scattering. Photons from a monochromatic source falling on the sample excite the particles to virtual energy states, and then are scattered with higher or lower energy to the output. This effect, called Raman shift, is dependent on the chemical structure of the sample.
In biological research, O-PTIR microscopy can be used to study "bulk" or single cells, e.g. bacterial cells. In conjunction with the chemometric analysis of the obtained spectra, it can be successfully applied to identify and classification of microorganisms.
 
Figure 6.   Principal Component Analysis (PCA) results of O-PTIR and Raman spectra of twelve bacterial strains.
Figure 6.   Principal Component Analysis (PCA) results of O-PTIR and Raman spectra of twelve bacterial strains.  Link.

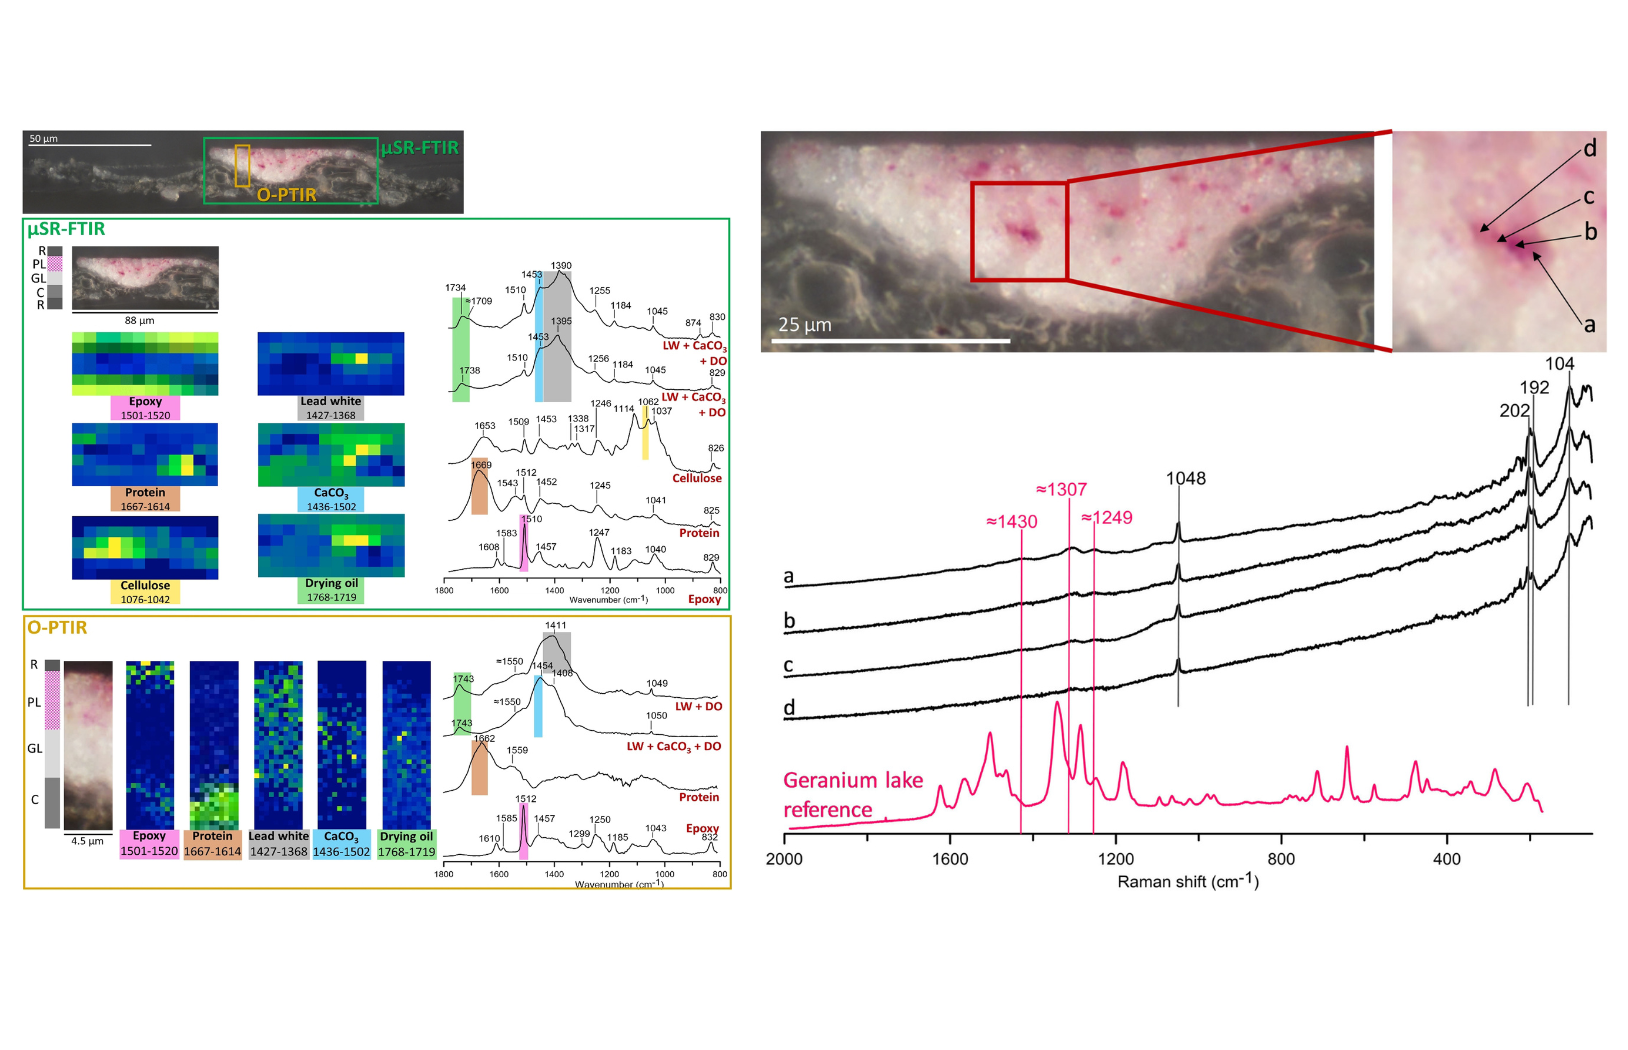
O-PTIR microscopy in studies of arts

Another advantage of IR microscopy is the small amount of sample needed for obtaining high-quality spectra and full characterization. This is highly important in research on cultural heritage, and historical paintings. 
In the study of 2021, a scrap of less than a millimeter taken from van Gogh's painting "Artesian" was used. O-PTIR imaging allowed the creation of compound maps used by the artist to make the images and the identification of the pink pigment.
 
Figure 7.O-PTIR analysis (integration maps and sample spectra) of the sample cross-section and the characteristics of the pink pigment.
Figure 7.O-PTIR analysis (integration maps and sample spectra) of the sample cross-section and the characteristics of the pink pigment.Link.

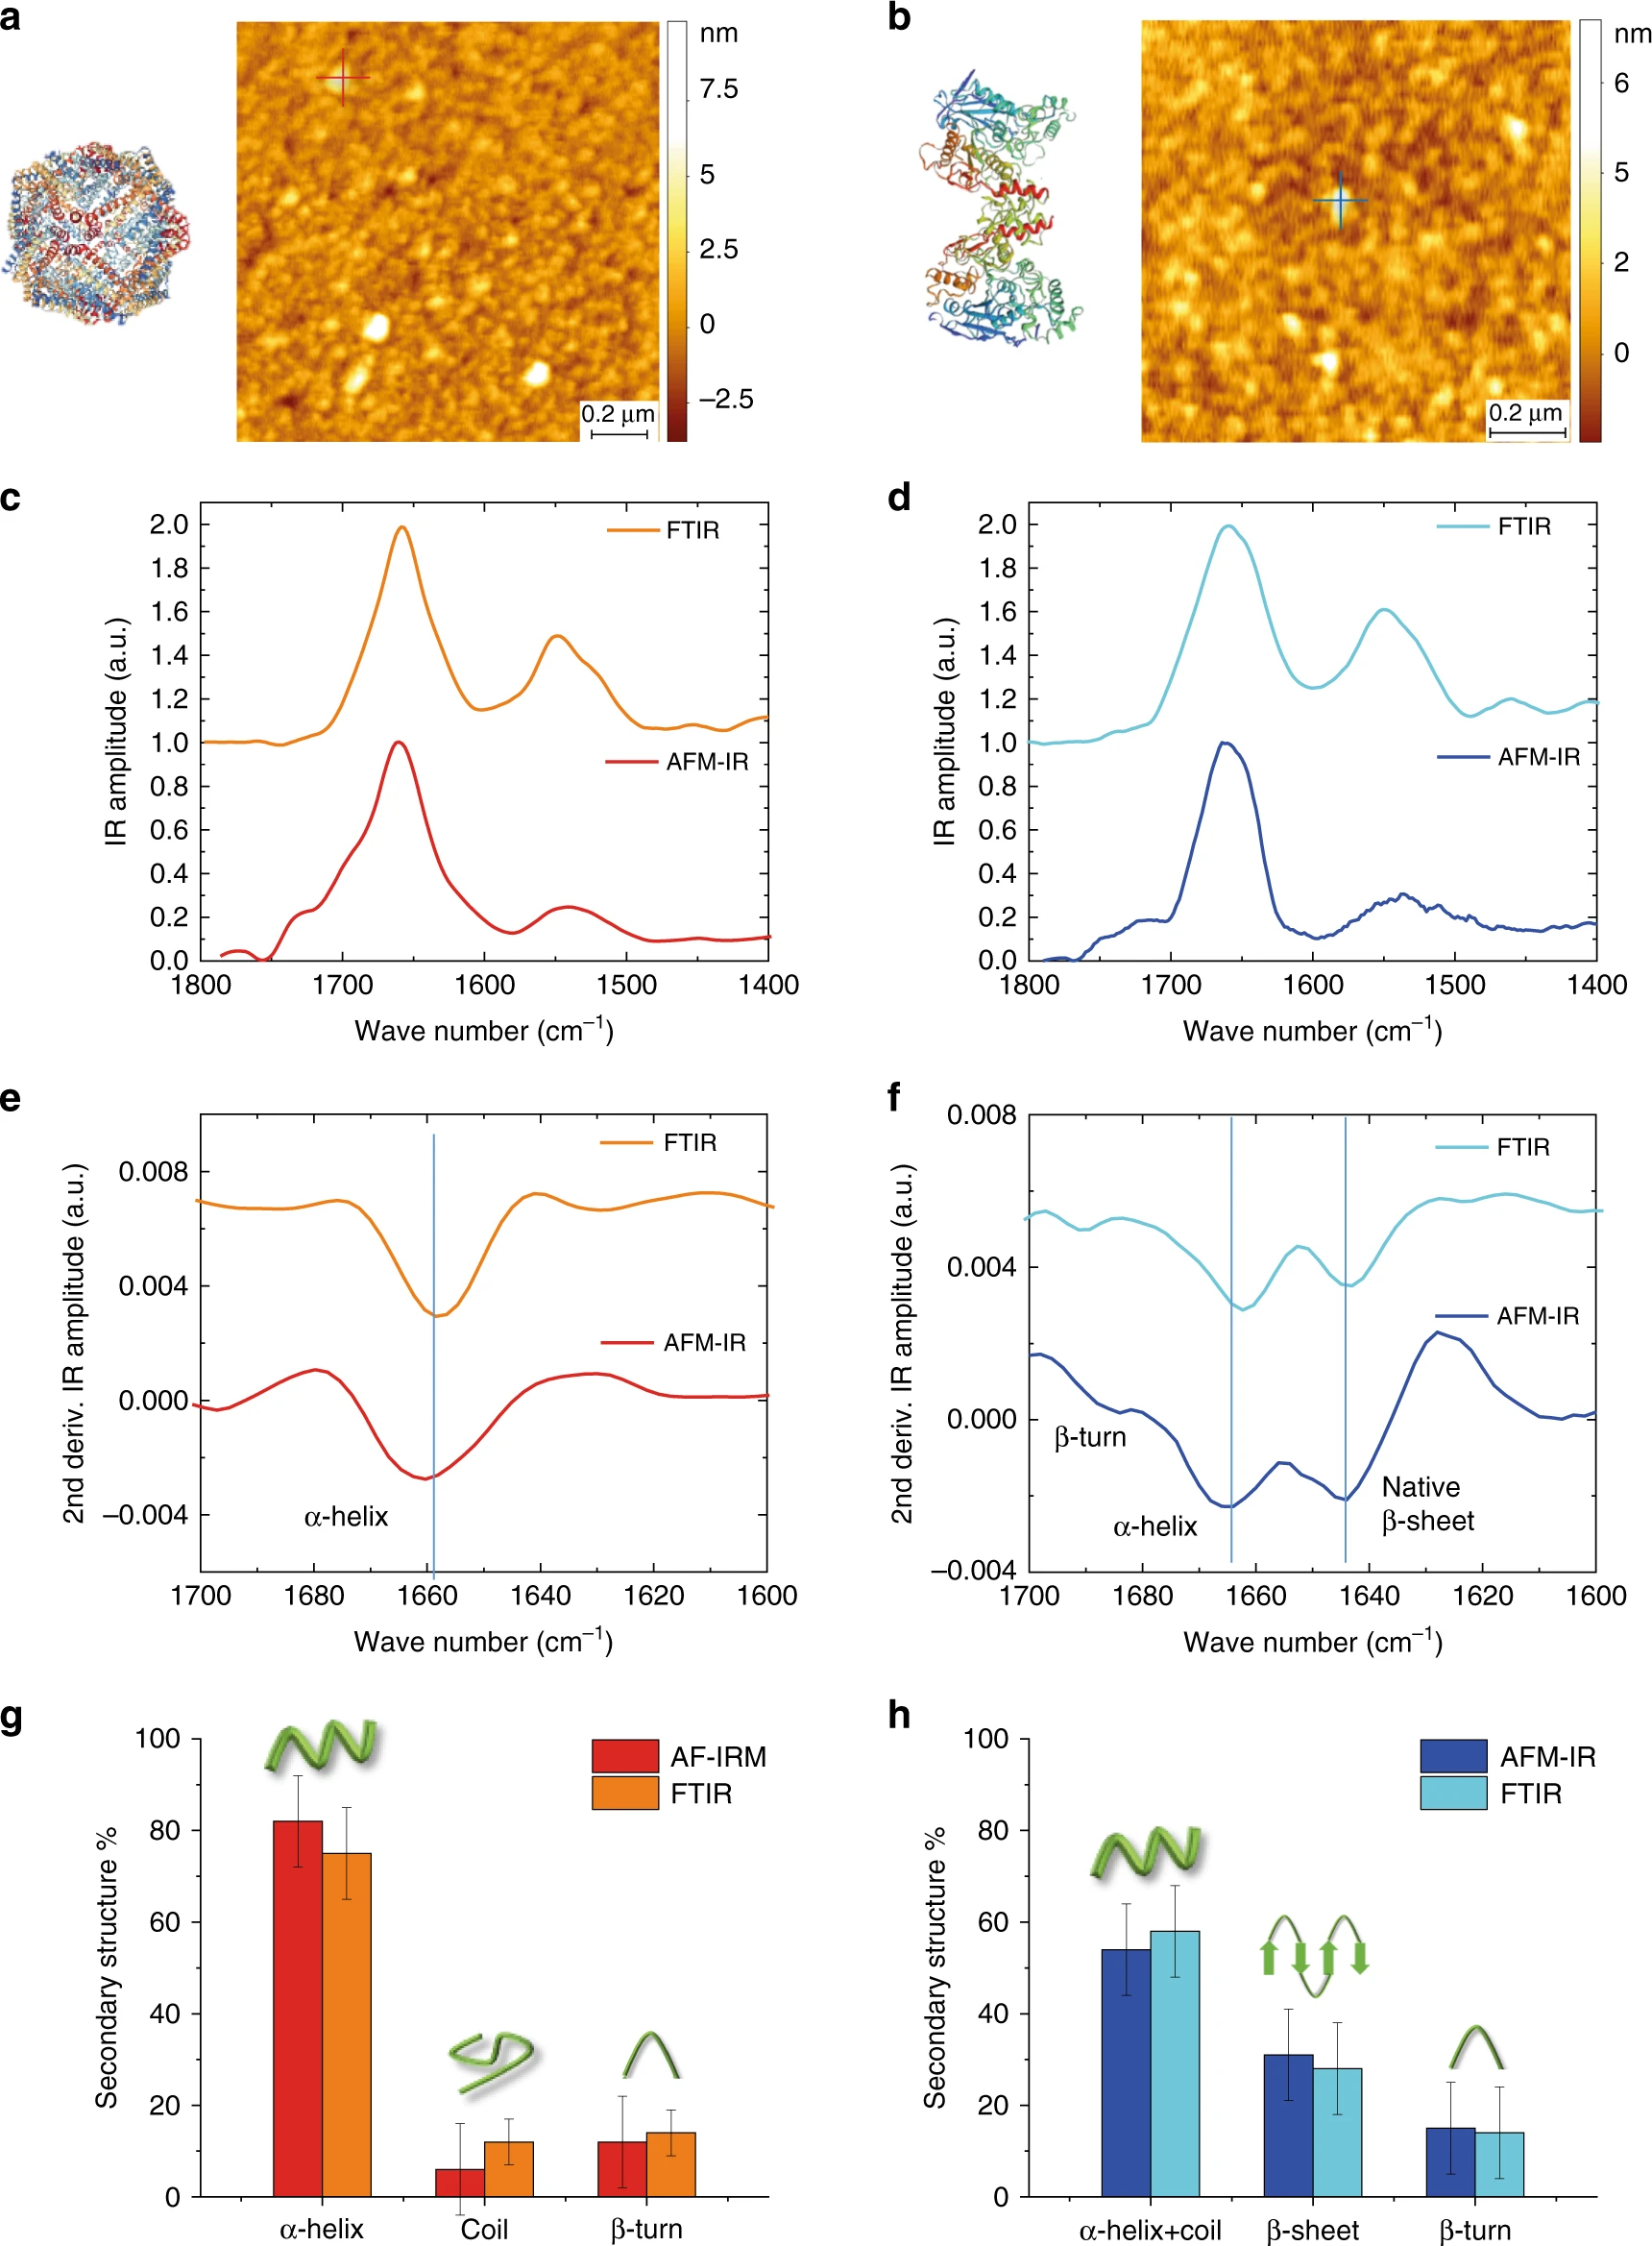
The secondary structures of proteins

The structure of many materials is ordered in at least a few steps - this is the so-called hierarchical structure. Linear polarized FT-IR microscopy allowed our team to identify and determine the orientation and organization order of collagen fibers. The diameter of single collagen fibers is up to 10 micrometers. A single collagen chain is made up of repeating amino acid sequences. Twisted chains can take various spatial forms, including α-helix and β-sheet. The molecules are packed into fibrils with a diameter of several hundred nanometers and these form fibers. Protein properties, functions, and the type of interaction depend not only on their chemical composition but also on their architecture.
Rysunek 8. Budowa hierarchiczna włókna kolagenowego.
Figure 8. Hierarchical structure of collagen fibers.
 
AFM-IR microscopy allows obtaining an IR signal from a single protein and determining its secondary structure based on the amide I band, which is 80% composed of vibrations stretching from the carbonyl group (C = O).
Rysunek 9. Określenie struktury drugorzędowej białek (ferrytyna i tyreoglobulina) z użyciem pojedynczej molekuły.
Figure 9. Determination of the secondary structure of proteins (ferritin and thyroglobulin) using a single molecule. Link. 

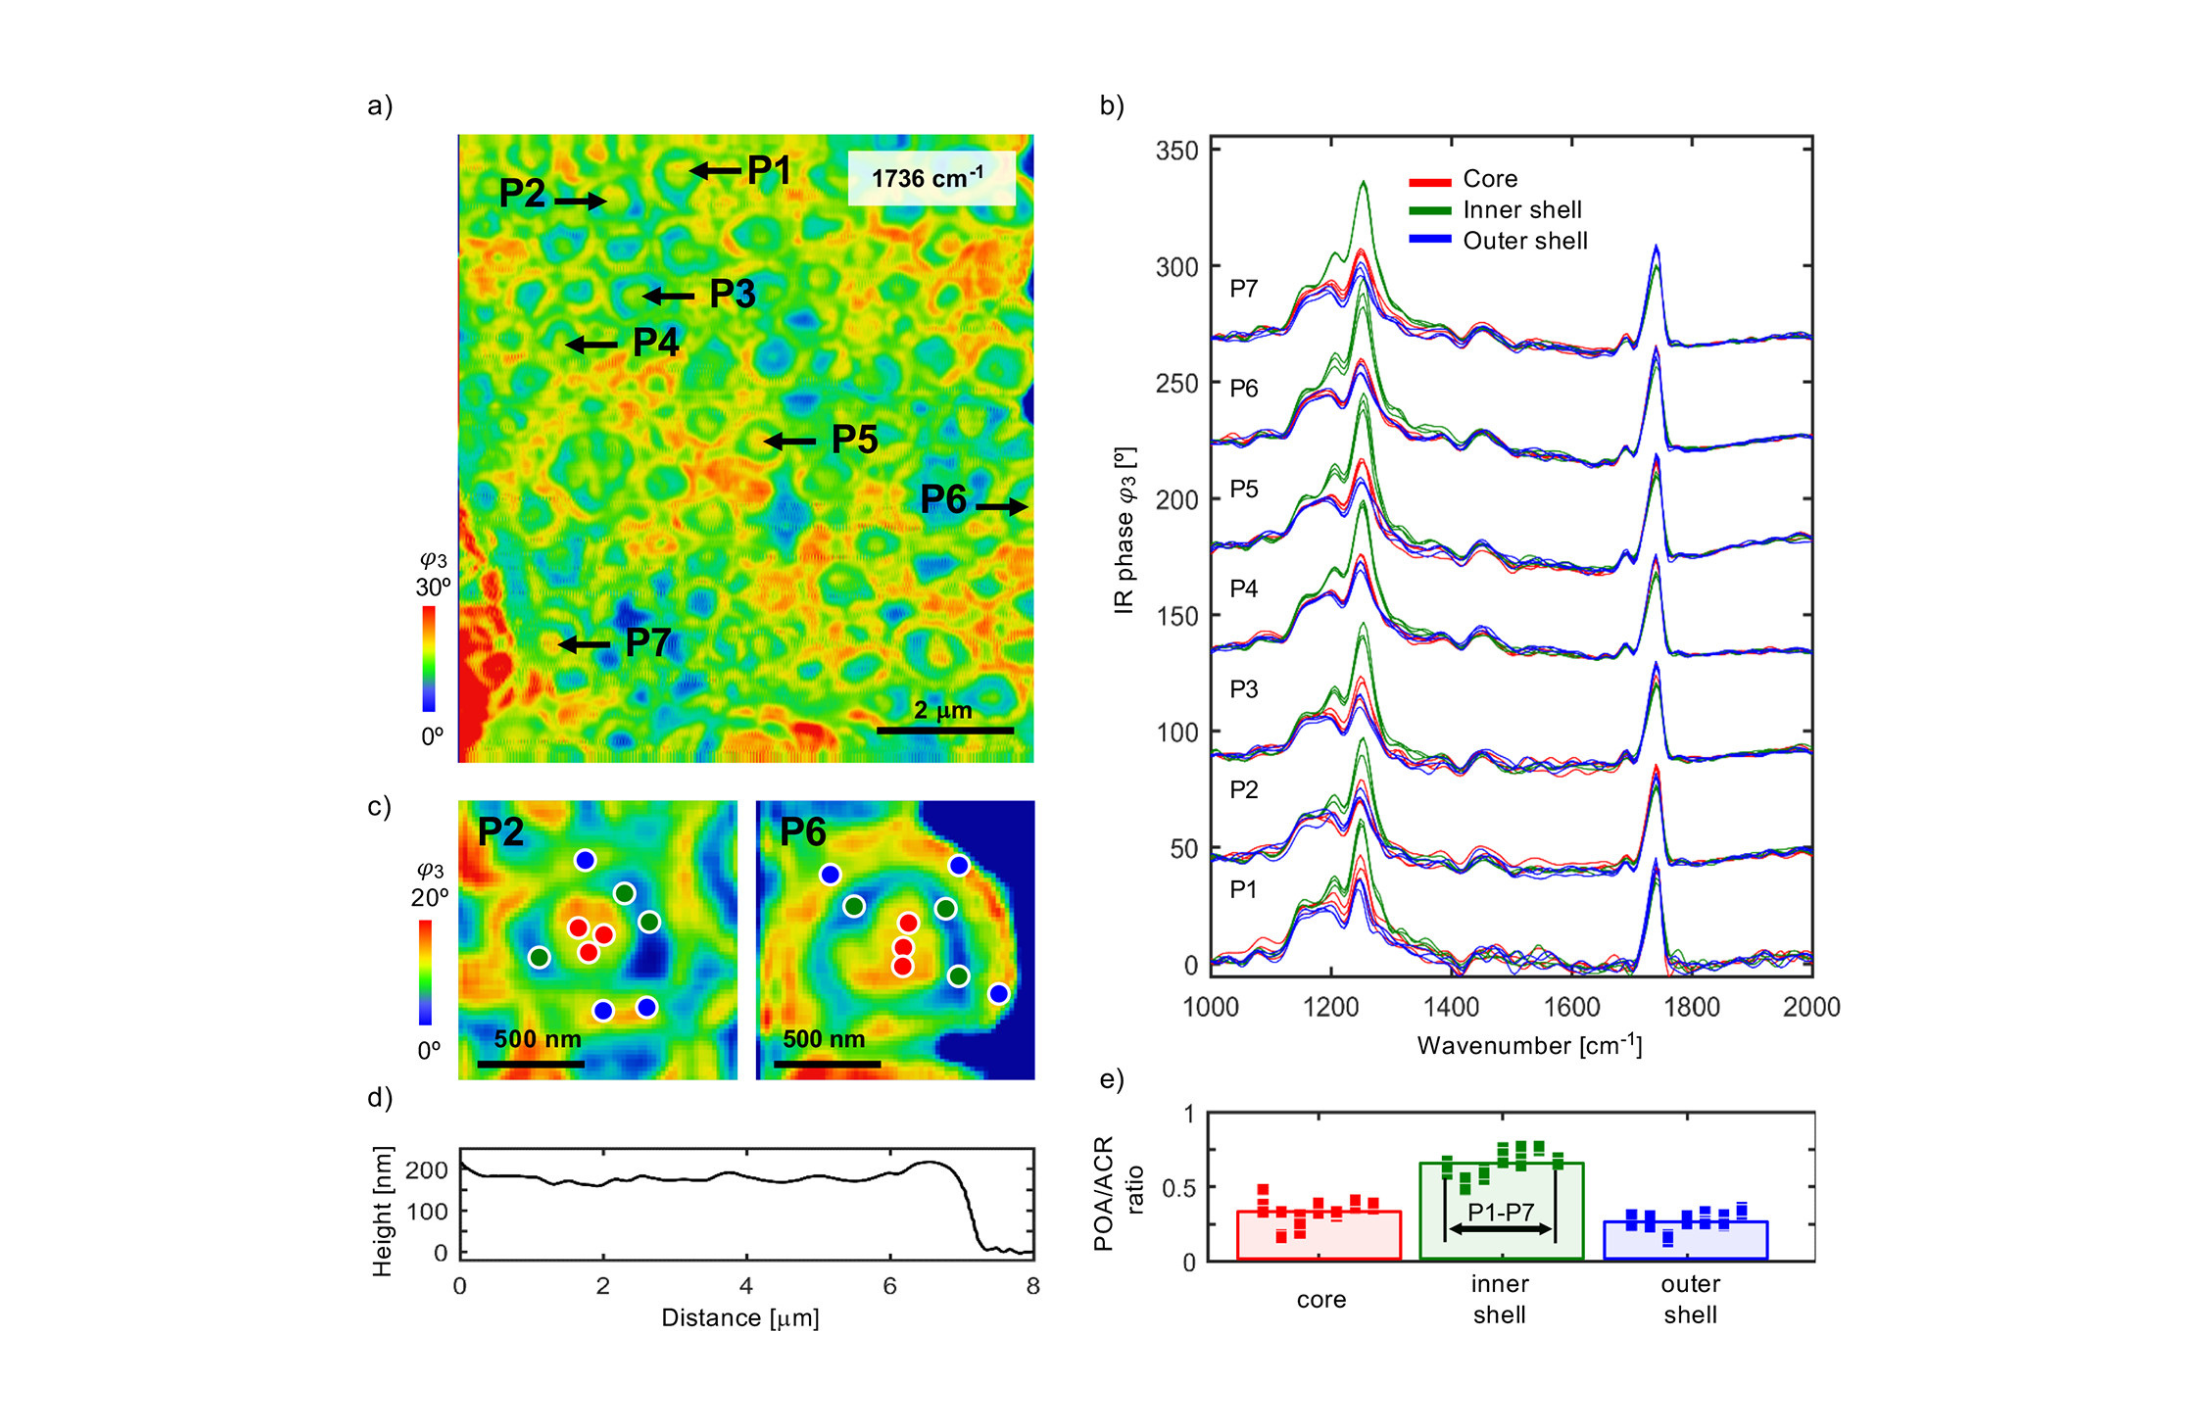
Polymers nanostructures

The spatial resolution of sSNOM is limited mostly by the diameter of the AFM tip. Research from 2021 has shown that using sSNOM and AFM-IR it is possible to distinguish three nano-layers in polymer core-shell nanomaterials, which was not achieved with TEM microscopy which lacks the chemical information.
Figure 10. Cross-section studies of various polymer nanoparticles with a layered structure. Three spectra were measured for each molecule for three layers: core, inner shell, and outer shell.
Figure 10. Cross-section studies of various polymer nanoparticles with a layered structure. Three spectra were measured for each molecule for three layers: core, inner shell, and outer shell. Link.

  1. “Translation of an esophagus histopathological FT‐IR imaging model to a fast quantum cascade laser modality”

Danuta Liberda, Michael Hermes, Paulina Koziol, Nick Stone, Tomasz P. Wrobel
Journal of Biophotonics 2020, DOI:10.1002/jbio.202000122

  1. “Macromolecular orientation in biological tissues using four-polarization method in FT-IR imaging”

Paulina Koziol, Danuta Liberda, Wojciech M. Kwiatek, Tomasz P. Wrobel
Analytical Chemistry 2021, DOI: 10.1021/acs.analchem.0c02591

  1. Spatially resolved macromolecular orientation in biological tissues using FT-IR imaging”

Karolina Kosowska, Paulina Koziol, Danuta Liberda, Tomasz P. Wróbel.
Clin. Spectroscopy 2021, 3, 100013, December 2021, DOI: 10.1016/j.clispe.2021.100013

  1. “Super-Resolved 3D Mapping of Molecular Orientation Using Vibrational Techniques”

Paulina Koziol, Karolina Kosowska, Danuta Liberda, Ferenc Borondics, Tomasz P. Wrobel
J. Am. Chem. Soc. 2022, 144, 31, 14278–14287, DOI:  10.1021/jacs.2c05306

  1. “Simultaneous Raman and infrared spectroscopy: a novel combination for studying bacterial infections at the single cell level”

Cassio Lima, Shwan Ahmed, Yun Xu, Howbeer Muhamadali, Christopher Parry, Rachel J. McGalliard, Enitan D. Carrol and Royston Goodacre
Chem. Sci., 2022,13, 8171-8179, DOI: 10.1039/D2SC02493D

  1. “Nanoscale Analysis of Historical Paintings by Means of O-PTIR Spectroscopy: The Identification of the Organic Particles in L′Arlésienne (Portrait of Madame Ginoux) by Van Gogh” 

Victoria Beltran, Andrea Marchetti, Gert Nuyts, Margje Leeuwestein, Christophe Sandt, Ferenc Borondics, Prof. Karolien De Wael
Angew. Chem., 2021, Issue 42, Volume 133, 22935-22942, DOI: 10.1002/ange.202106058

  1. “Single molecule secondary structure determination of proteins through infrared absorption nanospectroscopy”

Francesco Simone Ruggeri, Benedetta Mannini, Roman Schmid, Michele Vendruscolo, Tuomas P. J. Knowles 
Nat. Commun., 2020, 11, 2945, DOI: 10.1038/s41467-020-16728-1

  1. “Cross-Sectional Chemical Nanoimaging of Composite Polymer Nanoparticles by Infrared Nanospectroscopy”

Monika Goikoetxea, Iban Amenabar, Stefano Chimenti, Maria Paulis, Jose Ramon Leiza, and Rainer Hillenbrand
Macromolecules 2021, 54, 2, 995–1005, DOI: 10.1021/acs.macromol.0c02287