
The SOLARIS Cryo-EM Facility provides sample freezing, grids screening and high-resolution cryo-EM data collection with a wide range of applications, including single particle analysis (SPA), cryo-electron tomography (cET), and microcrystal electron diffraction (MicroED).
We support academic and industrial users for both service and collaborative projects.
Available cryo-EM techniques – interactive description (by Thermo Fisher Scientific)
- single particle analysis (SPA) - link to webpage.
- cryo-electron tomography (cET) - link to webpage.
microcrystal electron diffraction (MicroED) - link to webpage.
Important notes - before and after the cryo-EM experiments
- Preferably all samples should be experiment-ready (well-characterized, frozen and available on-site) at least one week before the scheduled Krios G3i cryo-EM session to avoid any delays and to guarantee optimal use of the measurement time.
- Trained users are allowed to perform sample screening on the Glacios microscope under the supervision of the SOLARIS cryo-EM scientists.
- User datasets collected during the cryo-EM experimental session are stored for up to 30 days at the SOLARIS storage server. After that period, data may be removed without prior user notification.
- Sample grids are stored for up to 6 months after completing the cryo-EM experiment. After that period the samples may be disposed of without prior user notification.
- User operations in all experimental steps can be supported by experienced SOLARIS staff members.
- Glacios cryo-microscope (200kV): 1 shift lasts 24hrs of which 8hrs are intended for sample screening and 16hrs for data collection. The average data collection rate of the Falcon 4 detector is 450 movies/h, which translates into nearly 7 000 movies/shift (4.2 TB data).
- Krios G3i cryo-microscope (300kV): 1 shift lasts 60hrs of which 55hrs are intended for data collection. The average data collection rate of the K3 detector is 680 movies/h, which translates into nearly 40 000 movies/shift (16 TB data).
- To facilitate data copying we recommend bringing a 3.5’’ portable disk on the day of data collection, to start data copying on-the-fly. Alternatively, you can transfer data directly into other external storage resources.
- To start with the data analysis we recommend running 3D reconstruction packages using ACK Cyfronet AGH supercomputer resources (i.e. cryoSPARC).
Methodology
A standard cryo-EM workflow typically consists of 5 steps (Fig.1). It starts from the sample preparation/purification and cryo-EM grid preparation (vitrification), followed by sample screening and optimization. Optimised samples are then used for cryo-EM dataset acquisition, leading to high-resolution 3D structure reconstruction.
However, the initial quality of the sample prior to vitrification is most critical for the success of cryo-EM imaging and 3D structure reconstruction.
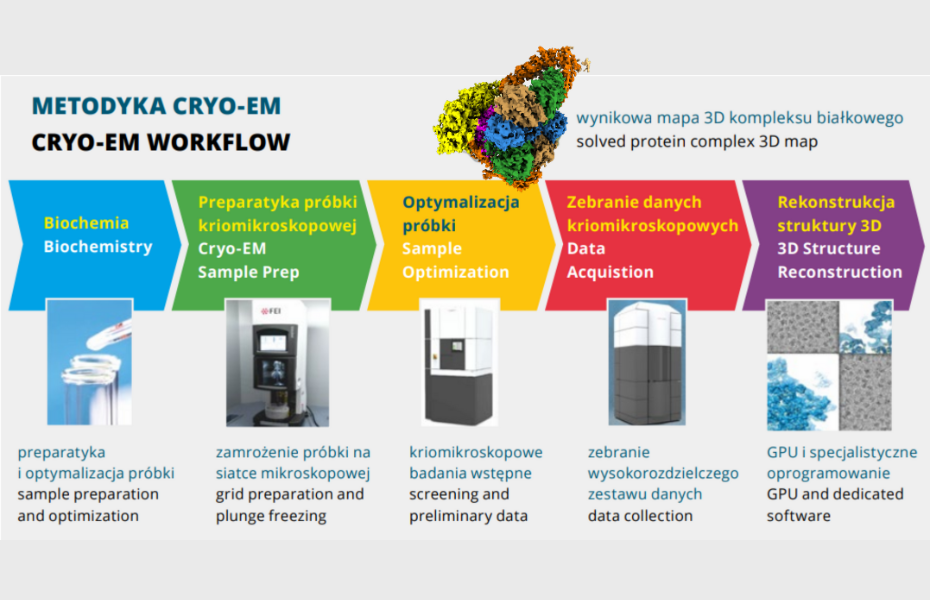
Fig.1. From biochemistry to 3D structure reconstruction of a macromolecule – a cryo-EM workflow.
Sample biochemistry
Any high-resolution single particle cryo-EM structure starts with a biochemically pure and stable sample of the isolated target molecules. Prior to vitrification, the biochemical preparation of the sample can be done in any standard biochemical laboratory, where at the same time the sample composition and homogeneity can be assessed using common biochemical/biophysical methods (e.g. polyacrylamide gel electrophoresis (SDS-PAGE), size-exclusion chromatography (SEC), native mass spectrometry (nMS) or dynamic light scattering (DLS)).
The ideal protein sample for cryo-EM studies should be of very high purity (>99%), minimal conformational heterogeneity (i.e. trapped in one state or only a few different states), contain none or very low level of cryo-protectants (e.g. glycerol) and has low ionic strength.
An exemplary biochemical analysis of an isolated and purified protein complex is presented in Fig. 2. Further biochemical analyses, including enzymatic activity, optical spectroscopy, and electrophoretic analyses indicated that this sample fraction contained a full complement of the Cyt b6f subunits and was enzymatically active.Therefore, this fraction was used for cryo-EM studies. (taken from Sarewicz et al., doi:10.1126/sciadv.add9688).
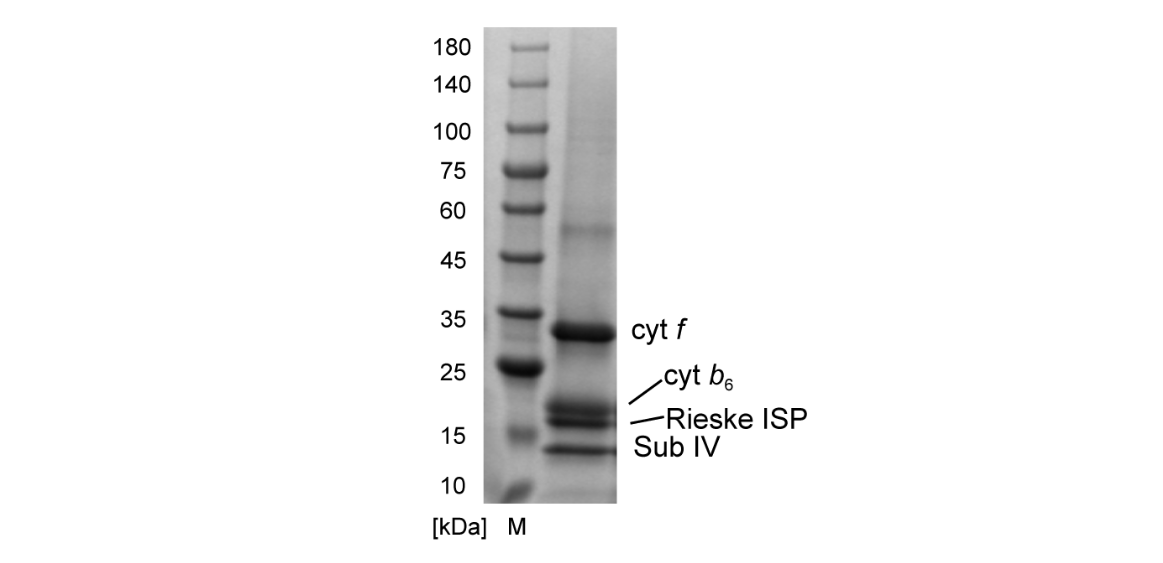
Fig. 2. Biochemical characterization of isolated and purified Cyt b6f proteins used in cryo-EM measurements - Coomassie-stained SDS-PAGE for respective proteins of a specific molecular weight. Sarewicz et al., doi:10.1126/sciadv.add9688
Cryo-EM sample preparation
For Cryo-EM measurements the buffer suspended particles must be flash frozen. The process begins with the activation of the microscope grids surface using a glow discharger. Subsequently, the particles of the hydrated sample are deposited on the grids and properly frozen. In order to preserve the native macromolecular structures, freezing has to happen rapidly enough to avoid crystalline ice formation. This is accomplished by plunging the grid into liquid ethane (vitrification) at high velocity using semi-automated plungers. The resulting, frozen and hydrated sample has individual sample molecules embedded and evenly distributed within a thin layer of amorphous ice.
Instrumentation for cryo-EM sample preparation available at the SOLARIS Cryo-EM Facility:
- carbon evaporator to prepare the TEM grid support (Safematic CCU-010 Compact Coating Unit) - providing an additional (e.g. carbon layer), which frequently helps to optimize particle density on the grid. More often, the device is used to prepare the surface of microscope grids by activating them in low-energy oxygen plasma, created by a glow discharge in a low vacuum. The increased hydrophilicity of the TEM grid film improves the wettability of its surface and thus helps to optimize the distribution of the ice. The glow discharge treatment can be controlled by appropriate settings – for instance, the height of the stage with the grids relative to the cathode, the plasma current or the exposure time.
- vitrification robot for plunge freezing of specimens for cryo-EM (Vitrobot Mark IV Thermo Fisher Scientific). Using a set of key parameters (i.e. sample blotting time, blotting force, relative humidity up to 100%, and temperatures from 4 to 60 °C) allows for reproducible preparation of high-quality vitrified samples. The process carried out in the environmental chamber is controlled digitally through a graphical user interface.
The glow discharge protocols and the vitrification protocols are available on-site. The SOLARIS cryo-EM specialists will also support novice cryo-EM users.
Sample
Cryo-EM samples are typically prepared using 2-3 μL of protein solution at 50 nM – 5 μM concentration, depending on the nature of the sample, used EM grid format, and conditions used for vitrification. Using freshly-prepared protein complexes can improve the vitrified sample quality - integrity, stability, and distribution, if the sample tends to aggregate or disassembles over time or is specifically sensitive to oxidation.
Apart from sample homogeneity, it is also important that the particles on the cryo-EM grid are frozen at optimal concentration, well dispersed and randomly oriented, so that views from all sides are available for 3D reconstruction. In some cases, where the specimen presents specific challenges, such as preferred particle orientation or protein denaturation at the air-water interface we suggest the following
- use ultra-thin-graphene-oxide-type grids that can improve particle density/dispersion in the ice and/or reduce the number of particles adopting a preferred orientation.
- use low concentrations of detergents,
- apply specific data collection methods that include exposures of tilted grids.
Girds
The optimum grid for each user project can be selected from a wide range of commercially available base grid materials and mesh sizes in combination with a variety of foil hole shapes, sizes and spacings. For high-resolution cryo-EM data collection, a sample support film should provide both, high sample stability and a low-background signal. Moreover, the geometry of the foil holes should be optimal for a given experimental method to obtain a high throughput of the experiment. As a starting point for high-resolution SPA of proteins and protein complexes we recommend a Quantifoil R2/1 Cu mesh 200, (i.e. a system of small holes with a diameter of 2 um and a distance between the holes of 1 um) or R1.2/1.3 small holes geometry would be optimal. In general larger sample sizes will require larger hole sizes and possibly additional support - especially for whole cells, fibrils, or bacteria. Tomography and materials science applications often benefit from larger open viewing areas (e.g. Cu 100 mesh) and less carbon film support (e.g. lacey carbon) due to extensive tilting of the grid.
Gird handling
To handle the frozen grids we are using patented AutoGrids and AutoGrids sample carriers (Thermo Fisher Scientific), which currently are the industry standard for robust and reliable loading and unloading of cryogenic samples using a robotic sample loader (Fig.3). AutoGrids also enable the seamless interchange of samples between different microscopes within the workflow.
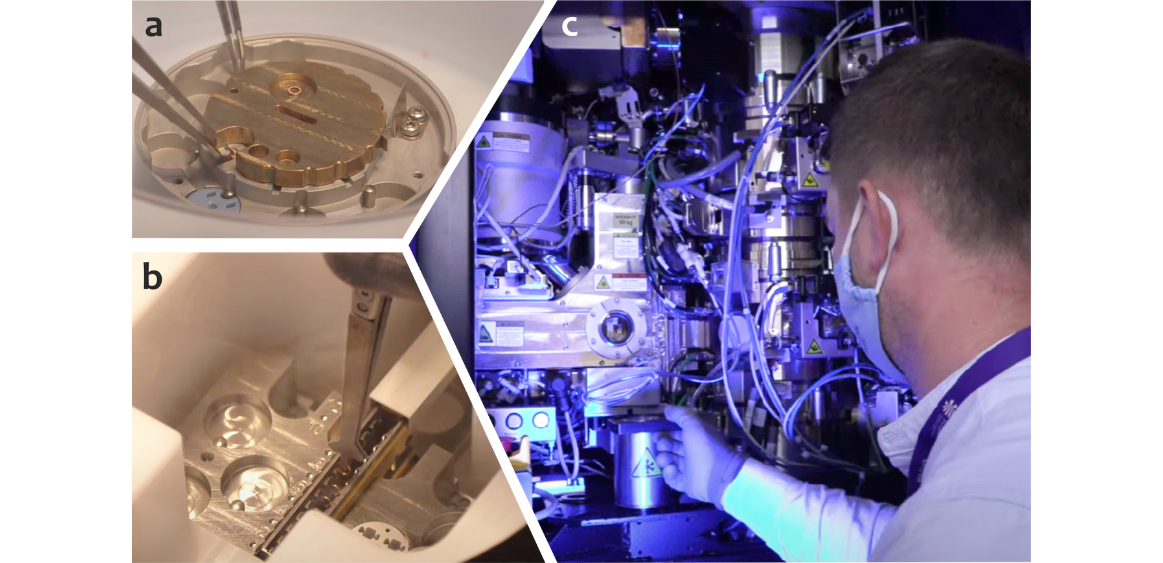
Fig. 3. Sample grids preparation for cryo-EM research: clipping of plunge-frozen sample grids (a), transfer to the cassette (b), and insert of the cassette with the samples into the autoloader of the cryo-EM microscope (c). Video frame: CiekaWizja Wiktor Niedzicki – Synchrotron SOLARIS.
Sample optimization
- ice thickness, and uniformity across the grid,
- ice quality, protein concentration, integrity, stability, and distribution of particles (if the sample aggregates or disassembles)
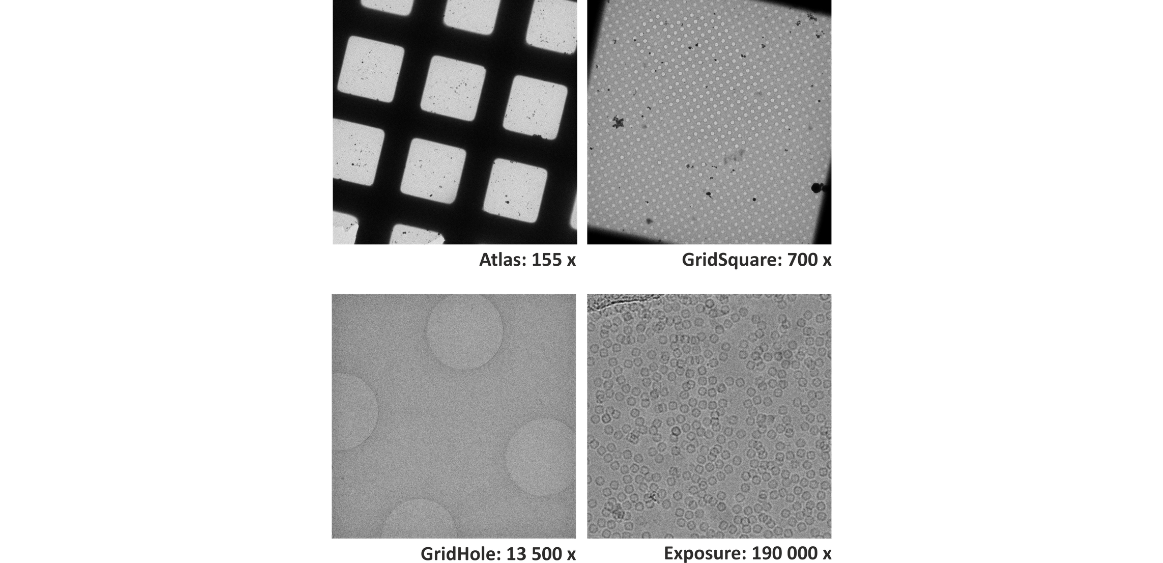
- 155x – the overview of multiple grid squares and ice thickness gradient - quality assessment,
- 700x – a closer look at chosen grid square of optimal ice thickness,
- 13 500x – checking ice with particles in the holes of the polymer film,
- 190 000x – target particle imaging and data acquisition.
As a result of the cryo-EM data analysis, a so called cryo-EM map or cryo-EM potential map is obtained. This conventionally used terms describe volumetric data that contains a representation of the studied molecule structure, as the projected Coulomb potential of the scattering atoms. The interpretation usually involves inspecting the iso-surfaces of the reconstructed cryo-EM map by using computational visualization software, followed by manual or automated annotation of map features using atomic coordinates and subsequent map/model refinement.
From SPA data recorded using a Glacios microscope, users routinely determine the 3D structures of macromolecules at resolutions in the range of 4-8 Å for small particles (<200 kDa) and less than 3 Å for medium and large particles (>400 kDa).
Data collection strategy
- Glacios cryo-microscope (200kV): 1 shift lasts 24hrs of which 8hrs are intended for sample screening and 16hrs for data collection. Average data collection rate of the Falcon 4 detector is 450 movies/h, which translates into nearly 7 000 movies/shift (4.2 TB data). From SPA data recorded using a Glacios microscope, users routinely determine the 3D structures of macromolecules at resolutions in the range of 4-8 Å for small particles (<200 kDa) and less than 4 Å for medium and large particles (>400 kDa).
- Krios G3i cryo-microscope (300kV): 1 shift lasts 60hrs of which 55hrs are intended for data collection. Average data collection rate of the K3 detector is 680 movies/h, which translates into nearly 40 000 movies/shift (16 TB data). Acquiring SPA datasets provides a unique opportunity to resolve a 3D structure of a macromolecule at a resolution of about 2 Å, which allows to obtain unprecedented molecular insight and the possibility to visualize fine details of the molecules (current best is 1.93 Å).
| Single Particle Analysis (SPA) | ||
|---|---|---|
| Microscope | Krios G3i | Glacios |
| High tension | 300 kV | 200 kV |
| Total dose on vacuum | 40 e/A2 | 40 e/A2 |
| Pixel size [A/px] | 0.846 A/px | 0.73 A/px |
| Spherical aberration | 2.7 mm | 2.7 mm |
| Frames per movie | 40 | 40 or EER fractions |
| Data type | TIFF/MRC | EER/MRC |
| Magnification on exposure | 105 000x | 190 000x |
| Defocus set range | -1.8, -1.5, -1.2, -0.9, -0.6 µm | -2.0, -1.5, -1.0 µm |
| Exposures per hole | 6-8 (/2µm) | 1-4 (/2µm) |
| Energy filter | Gatan BioQuantum-slit 20eV | N/A |
| Camera | Gatan K3 | TFS Falcon 4 |
| Camera mode | counting mode | counting mode |
| Dose rate on vacuum | 15-16 e/px/s | 6-8 e/px/s |
| Exposure image resolution | 5760 x 4092 | 4096 x 4096 |
| Image type | .tiff gain corrected | .eer gain not corrected |
| CRYOELECTRON TOMOGRAPHY (CET) | ||
|---|---|---|
| Microscope | Krios G3i | Glacios |
| High tension | 300 kV | 200 kV |
| Spectral aberration | 2.7 mm | 2.7 mm |
| Pixel size .mrc | 1.69 A/px | 4.00 A/px |
| Rozmiar piksela .tiff | 0.846 A/px | - |
| Pixel size .eer | N/A | 2.00 A/px |
| Total dose 'on vacuum' | 100-150 e/A2 | 100-150 e/A2 |
| Frames per movie | 10 | EER fractions |
| Collecion scheme | dose symmetric | dose symmetric |
| Titlt series (51 movies) | -50 to +50 deg, step = 2 deg | -50 to +50 deg, step = 2 deg |
| Defocus set | -5 um | -7 um |
| Magnification on exposure | 53 000x | 36 000x |
| C2 aperture | 50 um | 150 um |
| Camera | Gatan K3 | TFS Falcon 4 |
| Camera mode | counting super resolution | counting mode |
| Dose rate on vacuum | 15-16 e/px/s | 6-8 e/px/s |
| Exposure image resolution | 5760 x 4092 | 4096 x 4096 |
| Movie type | .tiff gain corrected | .eer gain not corrected |
| Energy filter | Gatan BioQuantum - slit 40eV | N/A |
3D structure reconstruction and visualization
The three-dimensional structure of macromolecules is reconstructed from thousands of micrographs of individual molecules, showing their two-dimensional projections in various, random orientations. However, to achieve a reconstruction at the highest resolution and to simplify structure determination the particles need to be structurally homogenous and display only limited intrinsic structural flexibility/heterogeneity.
A single-particle analysis (SPA) cryo-EM dataset consists of numerous 2D projection images of particles, which can subsequently be processed by reconstruction software, resulting in a high-resolution 3D model of the molecule's structure. A number of academic software have been developed to facilitate data processing (manuals and software).
For Krios G3i cryo-EM data collection a 3D ab-initio structure determination, high resolution refinement, and heterogeneity analysis can be done on-the-fly from raw cryo-EM data during the experimental session.
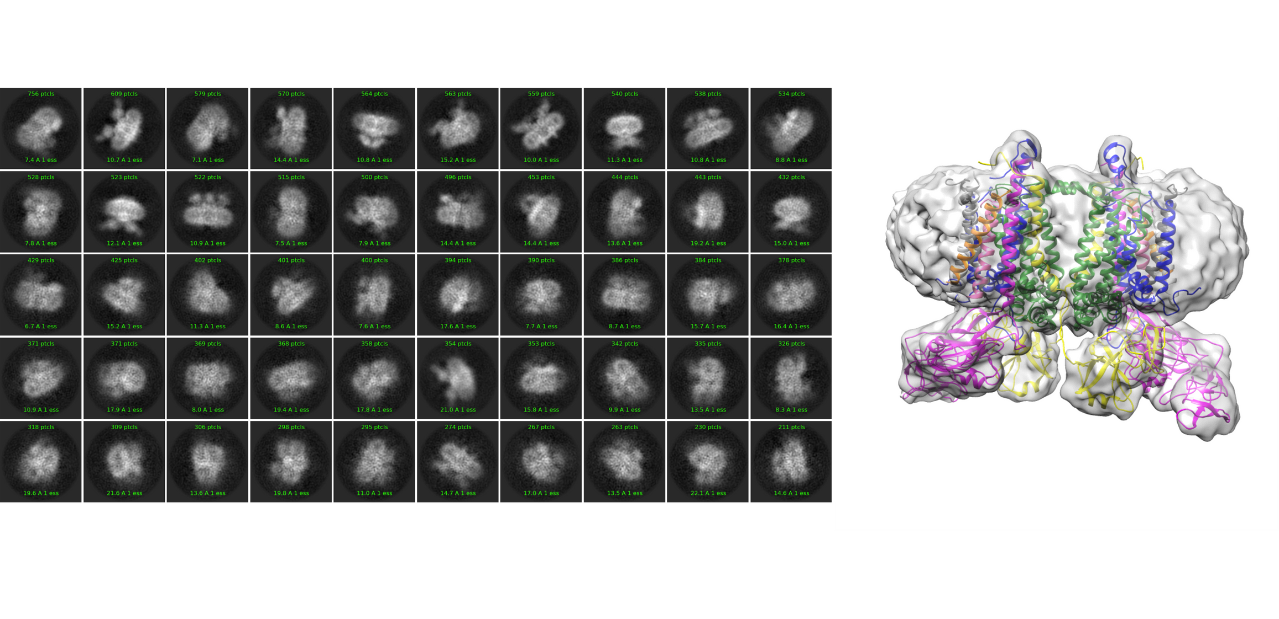
Representative cryo-EM datasets processing pipelines of Cyt b6f–PC and Cyt b6f complexes using cryoSPARC and RELION software are presented in Fig.7.
- To start with the data analysis we are recommending running 3D reconstruction packages using Cyfronet supercomputer resources (i.e. cryoSPARC).
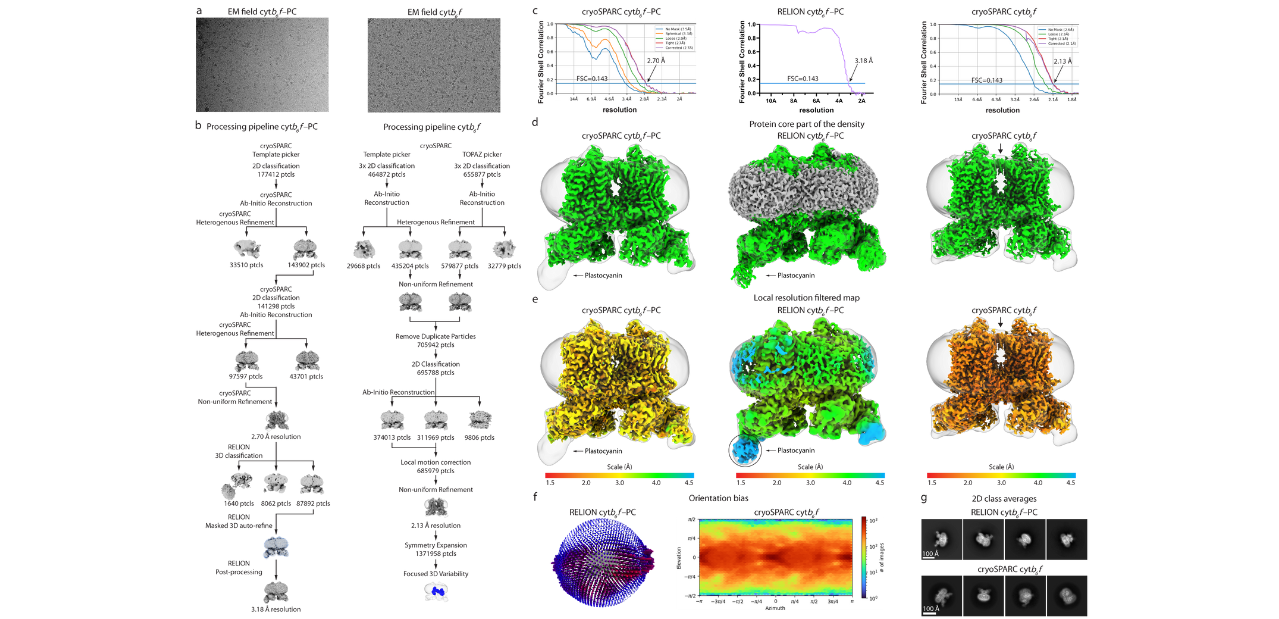
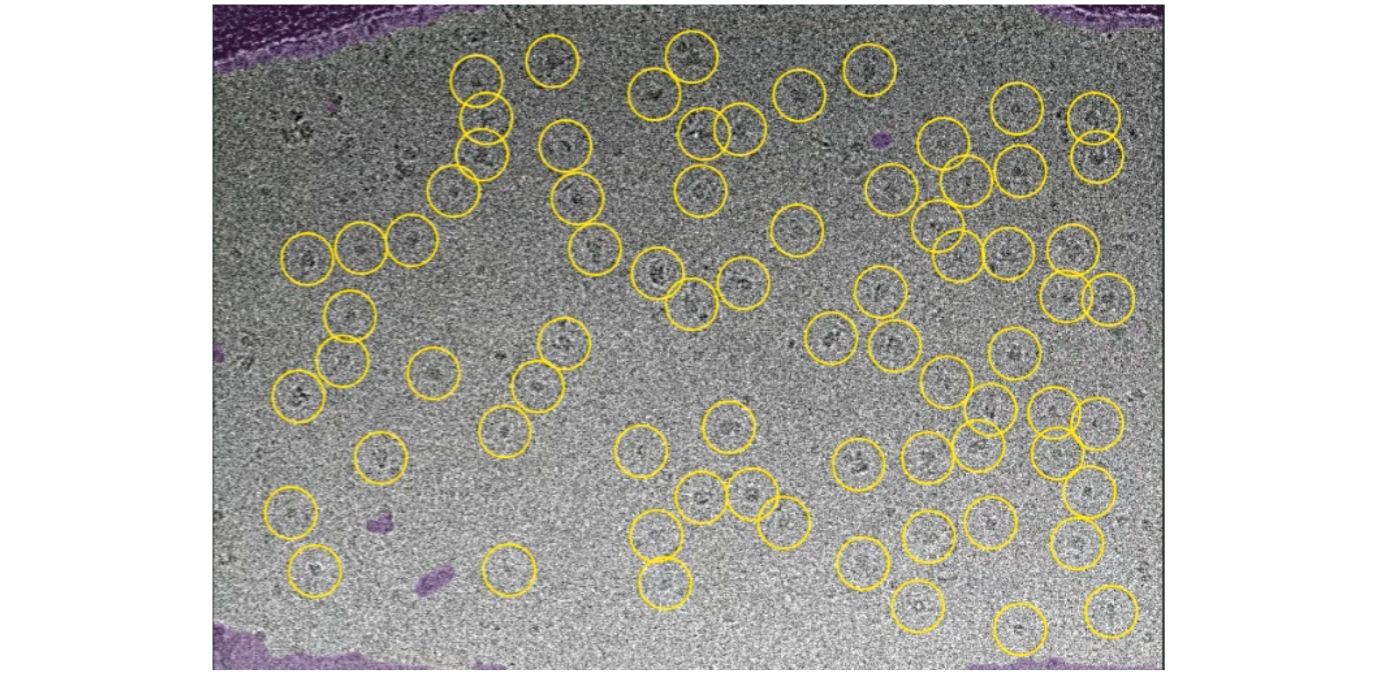
Fig. 7. Cryo-EM datasets processing of Cyt b6f–PC and Cyt b6f complexes. a, Representative cryo-EM fields. b, cryo-EM data set processing pipelines. c, Fourier Shell Correlation curves. The blue lines indicate FSC=0.143 with labelled resolution cut-offs. d, Protein core part of densities coloured in green (sharpened map) and overlaid with transparent densities including lipid shell (gaussian smoothed sharpened map). All maps countered to RMS level 5. e, The resolution range of all maps at RMS level 5, with Plastocyanin countered to RMS level 3 for the RELION map. f, Euler angle distribution of the Cyt b6f–PC particles contributing to the final RELION reconstruction and particle angular distribution calculated in cryoSPARC for Cyt b6f map. Heat map represents the number of particles for each viewing angle. g, Selected 2D class averages of the particles contributing to the RELION Cyt b6f–PC and Cyt b6f maps. (Sarewicz et al., doi:10.1126/sciadv.add9688)
IT infrastructure: data storage, transfer and processing
- The current available disk space of processing storage capacity at SOLARIS servers is 231 TB on the Krios G3i microscope and 1.4 PB on the Glacios microscope. The latter one is based on the Dell PowerScale solution, ensuring the security of the collected data and allowing for easy and ergonomic administration.
- For the purposes of data analysis, a computing server equipped with a two CPUs (total 72 threads/cores) and a Tesla V100 GPU with 32 GB memory is available, which significantly speeds up cryo-EM calculations. The system is aided by 750 GB of RAM memory.
- Additional 3 GPU workstations for cryo-EM movies pre-processing are available.
- 10 Gb band connections between all systems allows fast data transfer rates.
Sample storage
User samples can be frozen on-site at SOLARIS cryo-EM Facility, or can be carried in a LN2 flasks from a nearby MCB sample preparation Facility (Structural Biology Core Facility). It is also possible to ship samples over longer distances in dry shippers to the SOLARIS Cryo-EM Facility after previous arrangements with the research team.- Preferably all samples should be experiment-ready (well described, frozen and on-site) at least one week before scheduled cryo-EM session to avoid any delays and overloads.
- All users are allowed to use isolation dewars and holder systems for grid long-term storage available at SOLARIS cryo-EM Facility.
- Sample grids are stored for up to 6 months after finishing the cryo-EM experiment. After that period the samples are disposed of without prior user notification.