
The CIRI research line will ultimately be equipped with three end stations for imaging in micro- and nanometric spatial resolution. All end stations can use both a synchrotron source and a standard source (QCL or blackbody source). There is a possibility in the future to extend the line by a fourth end station.
The s-SNOM/AFM-IR microscope uses radiation in a wide spectral range. The atomic force microscope (AFM) is coupled to scanning near-field microscopy (sSNOM) and IR microscopy. The station is designed for microscopy with spatial resolution in the nanometric range.
1. Experimental Station
The first CIRI beamline experimental station is the FT-IR microscope (Hyperion 3000, Bruker) coupled with the Vertex 80V (Bruker) spectrometer. Depending on sample characteristics and experiment requirements the measurements can be carried out with a synchrotron beam or standard Globar thermal source.
2. Measurement geometry
The microscope is equipped with a condenser (bottom) and objective (upper). The infrared beam can be directed by a mirror system to the condenser (transmission mode) or the objective (reflection mode). Figure 1 shows the scheme of the FT-IR microscope.
Figure 1. Scheme of FT-IR microscope. Source: Bruker
In transmission mode, the focused beam from the condenser after partial absorption goes through the sample to the objective and is directed to the detector (Figure 2).
Figure 2. Transmission mode
In reflection mode, the beam from the objective focused on the sample surface is partially absorbed, and the reflected part goes back to the objective and is directed to the detector (Figure 3). One part of the objective is used to sample illumination, and the second one to signal collecting. The reflection spectra have a different profile compared to classical transparent spectra due to to complex nature of absorption and reflection effects. The bands in reflective spectra have changed shapes, and relative intensity and occur inverted. The measured spectra needed further mathematical processing, including transformation like Kramers-Kroning.
Figure 3. Reflection mode
The transflection mode is a version of the reflection mode. The beam for the objective goes through the sample, reflects from the substrate, and goes back to the objective. In this case, the beam goes through the sample two times (Figure 4).
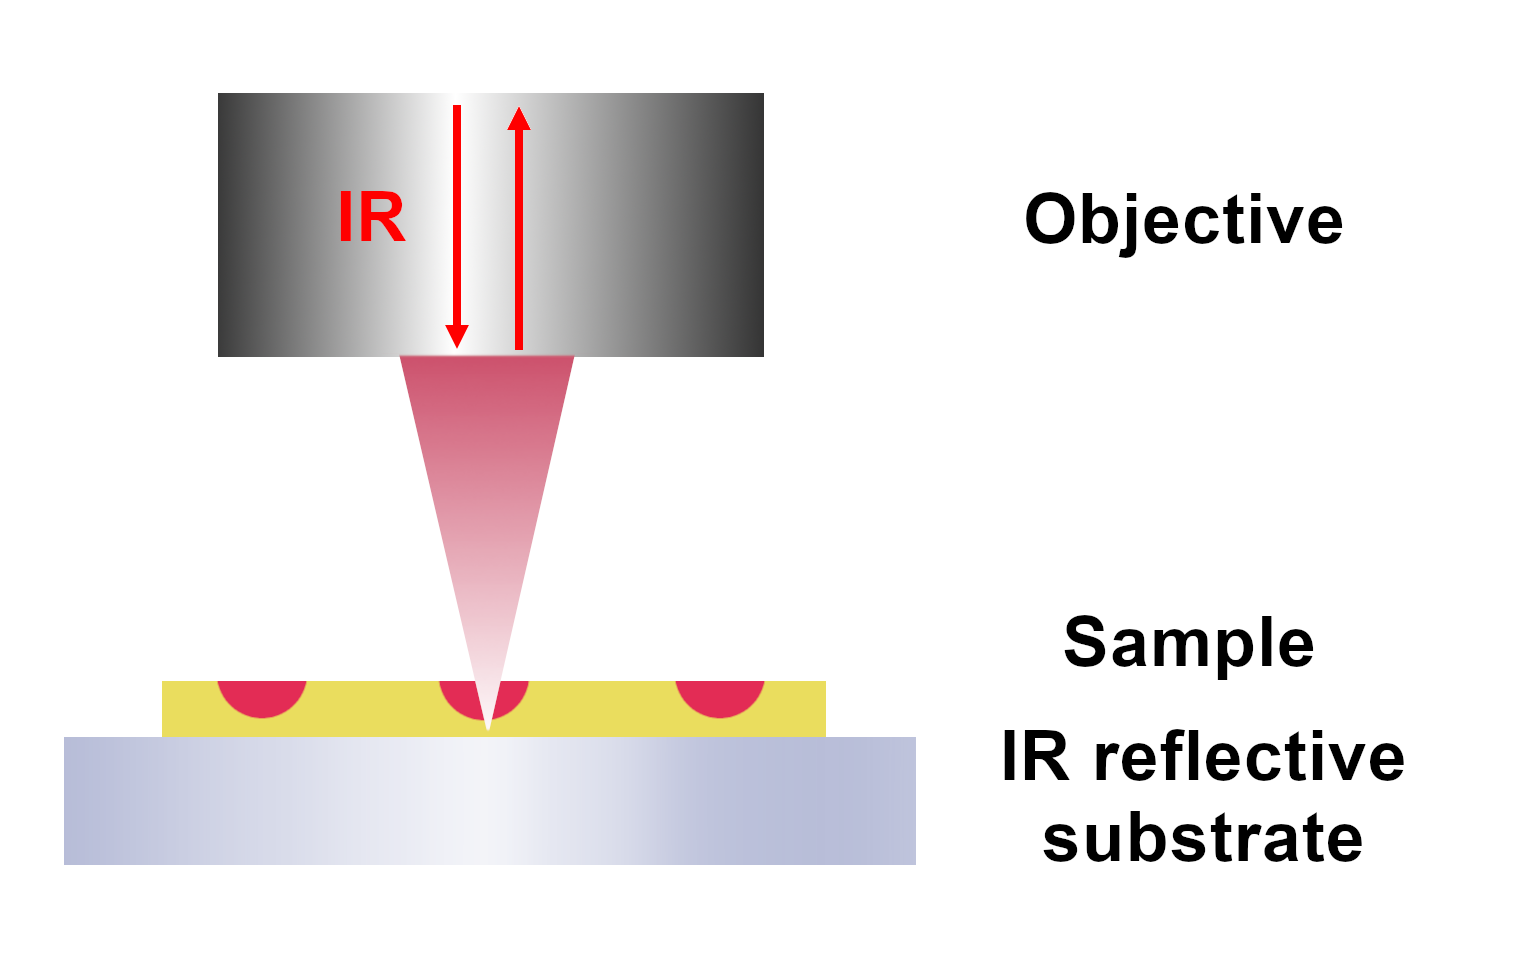
- Figure 4. Transflection mode
- The ATR exploits the attenuated total reflection effect for the measurement in the sample contact with the conical, germanium crystal in the ATR objective (Figure 5). The pressure force range is 0.5 – 8 N. As a result of the interference of the incident wave and the reflected wave, a standing wave is formed, which propagates in the direction perpendicular to the boundary of the so-called evanescent wave. Since the penetration depth depends on the wavelength of the incident radiation, a correction to the intensity of the received signal has to be applied. The ATR mode is the Surface method. The limitation of the method is the possibility of damaging the sample or crystal.
Figure 5. ATR mode
3. Measurement condition
Mapping with MCT detector (mercury-cadmium-telluride detector): the study area during single measurements is limited by a mechanical aperture. Mapping with the MCT detector is a point-by-point analysis of the sample (Figure 6).
Figure 6. Mapping: a) limitation of area with aperture, b) point-by-point analysis
The aperture wheel has 12 apertures of different diameters (from 0.3 to 3.75 mm) which can be rotated in the beam path. The measurement spot diameter depends on the objective magnification. Table 1 provides examples of diameters for five different apertures.
Tabela 1. Examples of apertures and measurement spot diameters for different objectives
| Aperture [mm] | Measurement spot diameter [μm] | ||||
| Objective 15x |
Objective 20x |
Objective 36x |
Objective 40x |
Objective 100x |
|
| 0.30 | 20.0 | 15.0 | 8.3 | 7.5 | 3.0 |
| 0.45 | 30.0 | 22.5 | 12.5 | 11.2 | 4.5 |
| 0.60 | 40.0 | 30.0 | 16.7 | 15.0 | 6.0 |
| 1.20 | 80.0 | 60.0 | 33.0 | 30.0 | 12.0 |
| 3.75 | 250.0 | 187.5 | 104.0 | 93.7 | 37.5 |
Imaging with FPA detector (Focal Plane Array): it is made of arrays of MCT detectors (64x64). Thanks to this type of construction, in a single measurement thousands of spectra are collected simultaneously, which makes the analysis much faster. The size of a single pixel depends on the magnification of the objective (Figure 7). The FPA imaging is not suitable for every kind of sample due to the much weaker signal on one MCT detector in the FPA array compared to point mapping.
Figure 7. Imaging with FPA detector the pancreatic tissue in transflection mode. Images for absorption intensity of amide I band at 1650 cm-1 for all objectives, and intensity of the amide A band at 3290 cm-1 measured with 40x objective with the corresponding visible image. Source: https://doi.org/10.1016/j.saa.2025.125769
Table 2 summarizes the measurement methods available at the end station. When selecting the objective magnification, the morphology of the sample should be taken into account.
Table 2. FT-IR microscope measurement options
| Analysis method | Magnification | Numerical aperture | Pixel size [μm] | Working distance [mm] |
Spatial resolution [μm] for 1000 cm-1 | Detector | Spectral range |
|
Imagining
|
|||||||
Transmission |
3.5x | 0.15 | 11.4 | high | ~41 | FPA 64x64 | 4500-900 cm-1 |
| 15x | 0.40 | 2.7 | 24.0 | ~15 | |||
| 20x | 0.70 | 2.0 | 14.0 | ~9 | |||
| 36x | 0.52 | 1.1 | 10.4 | ~12 | |||
| 40x | 0.78 | 1.0 | 8.3 | ~8 | |||
| 100x | 0.80 | 0.4 | 1.8 | ~7.7 | |||
|
Transflection
|
3,5x | 0.15 | 11.4 | high | ~41 | ||
| 15x | 0.40 | 2.7 | 24.0 | ~15 | |||
| 20x | 0.70 | 2.0 | 14.0 | ~9 | |||
| 36x | 0.52 | 1.1 | 10.4 | ~12 | |||
| 40x | 0.78 | 1.0 | 8.3 | ~8 | |||
| 100x | 0.80 | 0.4 | 1.8 | ~7.5 | |||
ATR |
20x | 0.60 | 2.0 | in contact | ~10 | FPA 64x64 | 4500-900 cm-1 |
|
Mapping
|
|||||||
| Transmission |
3.5x | 0.15 | high | ~41 | MCT 250 μm | 5000-415 cm-1 |
|
| 15x | 0.40 | 24.0 | ~15 | ||||
| 20x | 0.70 | 14.0 | ~9 | ||||
| 36x | 0.52 | 10.4 | ~12 | ||||
| 40x | 0.78 | 8.3 | ~8 | ||||
| 100x | 0.80 | 1.8 | ~7,5 | ||||
| Transflection |
3.5x | 0.15 | high | ~41 | MCT 250 μm | 5000-415 cm-1 |
|
| 15x | 0.40 | 24.0 | ~15 | ||||
| 20x | 0.70 | 14.0 | ~9 | ||||
| 36x | 0.52 | 10.4 | ~12 | ||||
| 40x | 0.78 | 8.3 | ~8 | ||||
| 100x | 0.80 | 1.8 | ~7.7 | ||||
| ATR |
20x | 0.60 | in contact | ~10 | MCT 250 μm | 5000-415 cm-1 |
|

The standard MCT detector 1 mm dedicated to measurement with Globar source has a range of 12000-600 cm-1, with a KBr beamsplitter of range 8000-350 cm-1.
4. Sample requirements
The sample requirements are summarized in Table 3.
Table 3. Sample requirements
|
Transmission
|
Reflection |
Transflection
|
ART |
|
| Thickness | 5-30 μm | <10 mm | <15 μm | <10 mm |
| Roughness | - | <1 μm | <1 μm for imaging | <5 μm |
| Thickness uniformity | High for FPA imaging | High for FPA imaging | High for FPA imaging FPA | High for FPA imaging |
| Substrate | Transparent for IR | - | High reflective for IR (gold or different metal) | - |
| Maximal dimensions (w x l x t) with substrate | 25 x 40 x 10 mm | 25 x 40 x 10 mm | 25 x 40 x 10 mm | 25 x 40 x 10 mm |

Additional information:
1. The most popular sample substrates for transmission measurements are barium fluoride and calcium fluoride. The range of transparency depends on the substrate thickness:
https://www.crystran.com/optical-materials/calcium-fluoride-caf2
https://www.crystran.com/optical-materials/barium-fluoride-baf2
2. In the case of thick sample measurement in the reflection mode significantly less amount of light reaches the detector compared to thin film measurement in the reflection mode. For samples with high roughness, most light is scattered, therefore sampling is possible the ATR, transflection, or transmission is suggested.
5. Measurement conditions
· Measurement takes place at room temperature, in the atmosphere
· Measurements on the hot stage (maximal temperature range -196 °C – 600 °C) with liquid nitrogen cooling - possible after prior consultation with scientists working on the beamline
· Available measurements with linearly polarized light with manually rotated polarizers
· Standard spectral resolution: 2 – 16 cm-1, for mapping maximally 0.5 cm-1.
6. Sample holder
The sample on the substrate is placed on a movable stage, the maximum range of the stage movement is 50x75 mm. The preferred sample size is no more than 20x40x1 cm. Measurements of samples with other dimensions must be previously consulted with scientists working on the line.
The second end station of the CIRI beamline is a neaSCOPE microscope (neaspec GmbH, Germany - now part of attocube systems AG, Germany). The microscope combines an atomic force microscope (AFM) and infrared spectroscopy (IR). The measurements can be performed with nanometric spatial resolution below the diffraction limit of IR light. Depending on the characteristics of the sample and measurement needs, it is possible to use techniques based on two different phenomena, i.e. near-field scattering (s-SNOM, nano-FTIR) and photothermal expansion (AFM-IR). s-SNOM is based on an asymmetric interferometer where the AFM tip and the sample are located in one of the interferometer arms. The light from the tip-sample arm is recombined with the reference beam at the detector. Interferometric detection based on varying the reference mirror position, thus the reference phase, allows for simultaneous recording of the phase and amplitude of the tip-scattered light, which relate to the local absorption and reflectivity, respectively. Modulating the reference phase and corresponding signal detection enables complete suppression of the scattering background. Thus, s-SNOM returns pure optical and chemical near-field maps free of mechanical artifacts. Optical signals are acquired simultaneously with AFM topography and mechanical phase. A typical IR light source in s-SNOM is a quantum cascade laser (QCL). Nano-FTIR spectroscopy is a variation of s-SNOM in which a single-wavelength source is replaced with a broadband source, e.g. synchrotron beam or difference frequency generation (DFG) laser. This modification allows hyperspectral imaging (i.e. collection of the complete spectrum at every pixel of the scanned area) with nanoscale spatial resolution determined by the tip apex size. Finally, the AFM-IR technique uses thermal expansion of the sample under IR illumination. In this phenomenon, the sample increases its volume due to the absorption of the IR light. The expansion of the sample volume is detected by the AFM tip, which increases its deflection amplitude due to mechanical interaction with the sample. The method is dedicated to soft materials, characterized by a higher coefficient of thermal expansion.
A summary of all techniques available at the s-SNOM/AFM-IR end station is presented below:
| Phenomenon | Near-field scattering | Photothermal expansion | ||
|---|---|---|---|---|
| Illustration |  |
 |
||
| Technique |
s-SNOM imaging |
Nano-FTIR spectroscopy | AFM-IR contact mode | AFM-IR tapping mode |
| Measurement type | imaging | spectroscopy | imaging and spectroscopy | |
| Type of AFM mode | tapping | contact | tapping | |
| Source of IR light | QCL | synchrotron | QCL (synchrotron in future) | |
| Source type of emission | continuous wave (CW) | pulsed (kHz) | ||
|
Detection mode |
pseudoheterodyne (PH) | asymmetric interferometry | AFM tip deflection | |
|
Detector type |
LN2-cooled MCT detector | AFM tip | ||
| Spectral range [cm-1] | 925 - 1725 | 550 - 3200 | 890 - 1779 | |
| Spectral resolution [cm-1] | 1 | ≥ 6,25 | 1 | |
| Sample requirements | nanoobjects or thin films of high thickness uniformity (< 200 nm, recommended) adsorbing light in the mid-infrared region and permanently mounted on flat substrates (roughness < 2 nm, recommended) – AFM compatible | |||
| Type of substrate | silicon, gold | gold, silicon | silicon, gold, mica* | |
| Minimal sample thickness | ca. 5 nm | tens of nanometers | ||
| Sample + substrate dimensions (W x L x H) [mm] | max. 40 x 40 x 10 (10 x 10 x 1, recommended) | |||
| Signal collection depth | tens of nanometers | ca. 1 micron | ||
| Measurement environment | solid samples in the air (room temperature and standard pressure) | |||
* mica shows low thermal expansion but may contribute to the AFM-IR spectrum due to strong absorption bands in the mid-IR range.
The O-PTIR microscope is the third end station of the CIRI beamline. This is the second technique developed in recent years for measurements of infrared (IR) images with spatial resolution below the IR light diffraction limit. The microscope has two light sources – a probe laser with a wavelength in the visible range (532 or 785 nm, both available at CIRI beamline) and an infrared radiation source - a pulsed, tunable QCL laser, or a synchrotron source with a wide wavelength range.
During the experiment the sample is simultaneously illuminated with colocalized visible laser light and infrared light. When the frequency of the IR wave matches the vibrational frequency of the molecules, absorption occurs, leading to photothermal expansion and associated with it reduction in the index of refraction in the illuminated area of the sample. As a result, the intensity and angular distribution of visible light reflected, scattered, and/or transmitted by the sample is altered. The obtained signal is used to generate the spectroscopic infrared spectrum. The photothermal response depends on many parameters related to the sample, including the thermal conductivity, heat capacity and density of the absorbing molecules, as well as the power of the probe laser and the power of the infrared source. The spatial resolution is limited only by the wavelength of the laser acting as the probe.
Apart from the elastic scattering of photons, which is used for detection of IR absorption, inelastic scattering (Raman effect) occurs at the same time, i.e. the formation of photons with altered energy. As an effect, the Stokes and anti-Stokes lines appear in the spectra symmetrically on both sides of the Rayleigh line, with respectively reduced and increased frequencies. The O-PTIR method allows, thanks to the use of a visible laser, to obtain both infrared and Raman signals at the same time.
Figure 1. Simplified principle of O-PTIR measurement. For the detection of absorption of long-wavelength IR radiation short-wavelenghth visible radiation is used, allowing to dramatically improve the spatial resolution of the technique.
In-depth description of the O-PTIR microscopy along with requirements and examples is available in an open-access paper here: https://pubs.aip.org/aip/app/article/9/9/091101/3312368/A-tutorial-on-optical-photothermal-infrared-O-PTIR
Measurement configurations
In the O-PTIR microscope the sample can be illuminated by IR light from the top through Cassegrain objective or from the bottom through optics with off-axis parabolic mirror (OAP) as a focusing element.
When the IR is being directed through the top objective, it co-propagates with the visible probe beam. Both beams are arranged to be collinear and illuminate the sample from the same side at the same spot. In this configuration only Cassegrain objective can be used.
When the IR is being directed through the OAP system, it is delivered to the sample in counter-propagate configuration, that is from the opposite direction to the probe beam. In this configuration any top objective can be used for measurements, however, due to better optical parameters, refractive 50x or 60x objectives are preferred.
In the O-PTIR the IR light is not being detected directly by any detectors. The microscope is equipped with two detectors for visible light. One photodiode is adapted to detect scattered or reflected from the sample through the top objective. This photodiode can be automatically swapped for avalanche photodiode (APD) for experiments with photo and heat sensitive samples that require very low laser powers. The second photodiode is used for detection of light transmitted through the sample. It is used for samples that have low reflectivity or are too thin to scatter enough of the probe light.
The separate method of measurements can be used for samples with a strong fluorescence response. In the widefield method, fluorescence imaging is utilized for the detection of IR absorption from a defined area of the sample. For the experiment the counter-prop microscope configuration is used. OAP is set out-of-focus so that the IR light illuminates an area of the sample instead of being focused at a single spot. The measurements are performed by acquiring a sequence of fluorescence images with and without the IR light coming to the sample. By comparing those images with each other it is possible to reconstruct an IR spectra. With this method it is possible to obtain over 260 thousand IR spectra with 8 cm-1 resolution, in less than an hour.
Figure 2. Diagram of the optical configuration of the O-PTIR microscope.
Experiment setup, requirements and sample preparation
Measurements in the co-prop configuration do not require any sample preparation. The method has no requirements for sample thickness or the use of any specific substrates, especially if only single spectra from selected points on the sample are planned to be measured. The measurements are usually non‑destructive, requiring no contact between the objective and the sample. In case of samples with irregular surface, imaging mode is limited to only small areas. For light or heat sensitive samples, it is possible to conduct measurements at low laser powers using an avalanche photodiode.
Measurements in counter-prop configuration require:
- Sample thickness of no more than 10 µm
- Calcium fluoride substrate only, 10 mm in diameter, 0.35 mm thick
Slides in these dimensions fit into a holder adapted to the measurement table in the O-PTIR microscope and allow for quick start of planned experiments. Other IR-permeable substrates with a diameter of up to 2 cm and a thickness of up to 1 mm are still suitable for measurements, however, the quality of resulting spectra will be lower.
Requirements for the measurements in the widefield mode are similar to counter-prop mode. For the measurement to be feasible, the presence of strong autofluorescence or fluorescence from dyes in the sample is necessary.
For O-PTIR measurements in aqueous environments the microscope is equipped with 60x water-dipping objective. The requirements are analogous as in case of counter-prop mode.
|
|
O-PTIR measurement modes
|
||
|
Mode |
Co-propagating
|
Counter-propagating
|
Widefield
|
|
Physical phenomenon |
Light scattering, reflection or transmission |
Fluorescence |
|
|
Source of probe light |
532 and 785 nm |
380-580 nm, various filter cubes available |
|
|
Detection of the signal |
Photodiode through top (standard) or bottom (transmission) objective; avalanche photodiode (APD) for low laser powers |
Microscope camera |
|
|
Measurement mode |
Single spectra from selected points on the sample; imaging by single wavenumbers or hyperspectral imaging |
Imaging: single wavenumbers or hyperspectral |
|
|
Objectives |
Reflective 40x/NA 0.78 |
Refractive 50x/NA 0.80; refractive water-dipping 60x/NA 1.00 |
|
|
Imaging resolution |
Up to 300 nm, depends on the objective |
||
|
Pixel size |
Can be freely optimized |
50x – 0.130 μm 60x – 0.106 μm |
|
|
IR Light source |
QCL laser; Synchrotron in the future |
||
|
Spectral range [cm-1] |
QCL: 950-1800 cm-1, 2800-3000 cm-1 |
||
|
Substrate |
Any substrate, CaF2 prefered |
CaF2, thickness 0.35 mm, diameter 10 mm |
|
|
Sample size |
Any size |
Thickness below 10 μm |
|
|
Simultaneous Raman measurements |
Possible, depends on the sample and environment |
Impossible |
|
|
Measurement environment |
Air, water (sandwich configuration) |
Air, water (water dipping objective) |
|


