
UARPES end station
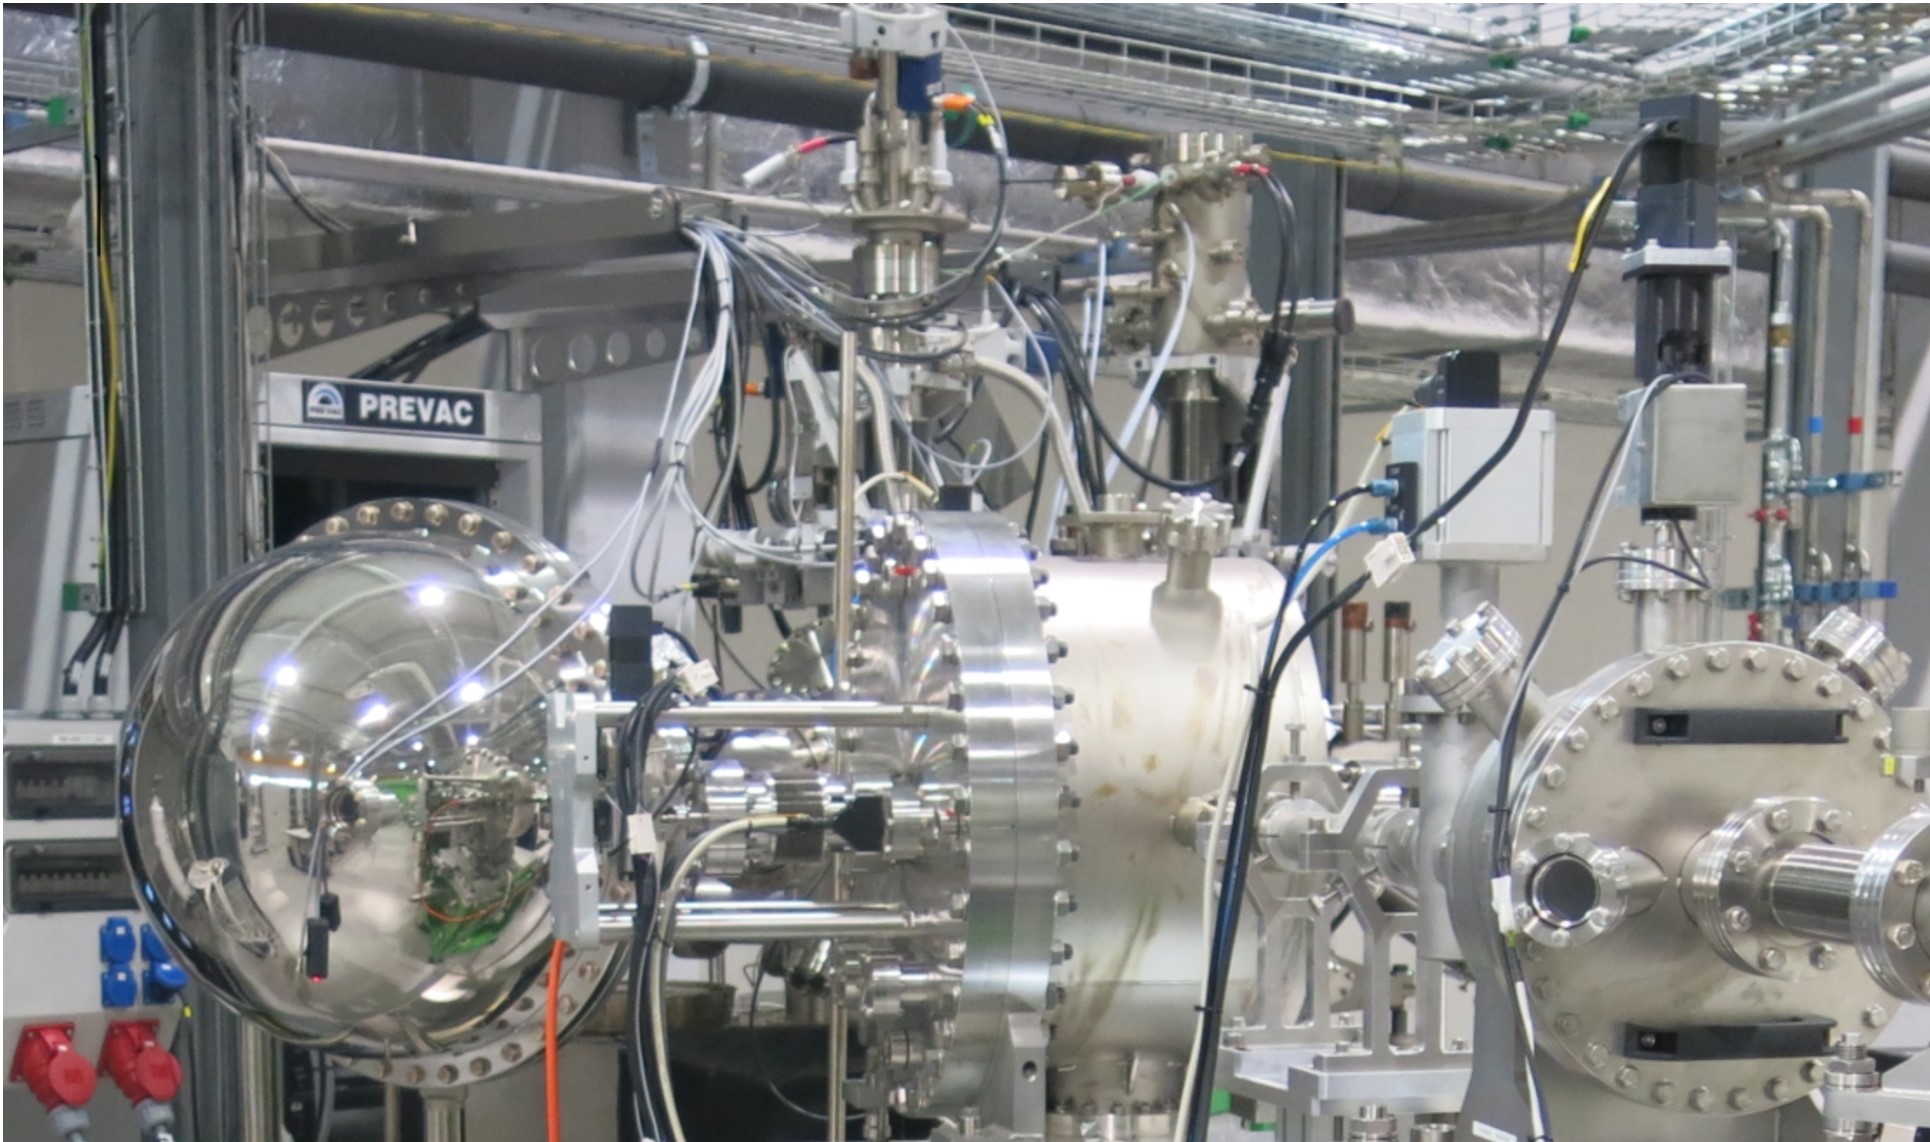
Figure 10. UARPES end station.
The end station consists of three chambers: loading, preparation, and analysis. The sample in the analysis chamber is located 28 m from the undulator. The area excitation by the monochromatic beam is 60 µm x 150 µm with the possibility of narrowing it down to a square of 60 µm x 60 µm through the exit slit.
In the analysis chamber, there is a six-axis cryogenic manipulator (3 translations and 3 rotation axes) with an open-flow cryostat, enabling the sample to be aligned in the axis of the electromagnetic optics of the analyzer and in the axis of the MCP-LEED diffractometer along with the ability to optimize the sample position in reciprocal space (aligning the sample with a high-symmetry crystallographic axis). During measurements, stable temperatures in the range of 2.5 - 500 K can be obtained by cooling with liquid helium (a temperature below 4.3 K is achieved by reducing the pressure of helium vapor above the liquid in the cryostat and in the dewar, approaching the pressure conditions of the superfluid state.) or liquid nitrogen; higher and intermediate temperatures can be stabilized by a heater mounted on a cryostat and by the flow of a coolant. The manipulator is fully motorized and automated and communicates with the SES program. The positioning accuracy of the Cartesian axes is on the order of 10 µm, whi
6-axis low-temperature manipulator movement range:
- R1: 0° to 355° (rotation around the long axis)
- R2: -5° to +95° (azimuth)
- R3: -20° to +40° (tilt)
- X, Y: ±25 mm
- Z: ±125 mm

Figure 11. Station of a 6-axis cryogenic manipulator with a flag/omicron holder and with the R2 axis movement range marked.
The base pressure at room temperature in the analysis chamber is <6×10-11 mbar (without the use of a cryogenic pump), which ensures a long lifetime during measurements even for reactive sample surfaces. For samples sensitive to hydrogen and residual UHV gases, it is possible and recommended to use a cryogenic pump; then the base pressure achieved is << 1 x 10-11 mbar.
For evaluation and analysis of the crystallographic quality and/or surface reconstruction of the samples, the MCP-LEED diffractometer (OCI Vacuum Microengineering Inc.) diffractometer is located in the analysis chamber.
The figure below shows the geometry of the ARPES measurements.

Figure 12. Measurement geometry. The angle between the axis of the detector and the beam of photons incident on the sample is 44°. The cryogenic manipulator has three Cartesian axes X, Y, Z and three rotational axes: R1 providing motion along the manipulator’s long axis over a range of 355°; R2, enabling azimuthal motion from –5° to +95°; and R3, allowing tilt motion from –20° to +40° relative to the sample-holder normal. The orientation of the entrance slit and the polarization vectors of the radiation are indicated, as well as the measurement scheme for the spin components. The manipulator axis labels are not equivalent to the designations of the photoelectron spin components.
The heart of the end station is the VG Scienta DA30L hemispherical photoelectron energy spectrometer, equipped with two VLEED-Ferrum spin filters. The hemispherical spectrometer is mounted in such that its input axis forms an angle of 44° with respect to the photon beam. The analyzer is aHemispherical Deflection Analyzer (HDA), a multiplexing spectrometer capable of simultaneously recording about 106 points of the photelectron angular-energy spectrum.
In the focal plane of the entrance lenses, there is a vertical entrance slit of the energy filter. Electrons entering the spectrometer at a given angle, i.e. also emitted from the sample at a given angle, are focused at one point on the focal plane by the entrance lens. As a consequence, the angular distribution of photoelectrons emitted from the sample towards the entrance slit is mapped on the focal plane. The electrons that pass through the slit further into the hemispherical filter region are then dispersed due to their energies, while keeping the ordering of the electrons due to entry angles. Behind the energy and angle filters is a highly sensitive 2D (MCP/CCD type) positional detector that records the electron current distribution on the plane. Then, the electron distribution is transformed from the detector plane to the space of angles and energies.
The DA30L detector is equipped with a system of deflectors in the area of the entrance lenses that allows to shift the angular distribution of photoelectrons mapped on the focal plane in the horizontal direction (perpendicular to the direction of the entrance slit). As a consequence, various sectors of the angular distribution that are not included in the spectrometer axis can be selected for energy analysis. For a stationary sample, the spectrometer can measure electrons whose directions fall within a 30° cone.
| Parameter | Value |
|---|---|
| Detector type | DA30L, MPC 2D 3D-VLEED Ferrum (two orthogonal spin filters) |
| Detector modes | Deflection (3D), ARPES, Spin-ARPES, XPS, UPS |
| Angular mods | ±3,5°,±7° ± 15° |
| Entrance slits |
0.1 – 2.5 mm, 9 different kinds 0.5 – 3.0 mm, 5 apertures for the spin detector |
| Energy resolution | Min.: 1.8 meV for PE = 2 eV, entrance slit 100 and 200; for ARPES measurements Min.: 2.42 meV for PE = 2 eV, apertures 1 and 2, for spin-ARPES measurements |
| Angular resolution | 0.1° |
| EPass energy [eV] | 2; 5; 10; 20; 50; 100; 200 |
| Energy chanels | 1064 |
| Angular chanels | 1000 |
The DA30L spectrometer allows you to measure three-dimensional maps of the photocurrent I(φ,θ,E), which then, using the software available on the beamline, can be transformed to momentum and energy space, obtaining the representation of the band structure.
An important advantage of using the deflection mode, which replaces the rotation of the sample, is the quick mapping in three dimensions (φ, θ and E) that does not require changes in the position (tilt), which eliminates the variability geometrical components in the transition matrix elements; the elimination of the risk of changing the excitation area on the sample during rotation (it is huge important for small samples which are mounted off-axis and small size of the radiation beam), and elimination of the change of the geometry during the, e.g. of the dichroism measurements.
The DA-30L spectrometer has 9 entrance slits with a width from 0.1 mm to 2.5 mm.
The energy resolution of the spectrometer ΔE can be expressed as:

• R0 is the radius of the hemispherical analyzer; for the DA30-L, R0=200 mm
• w is the entrance slit width [mm],
• Epass is the pass energy [eV].
The distance from the sample to the analyzer (working distance), which is also the focal point of the analyzer’s first lens, is 34 mm.
The angular resolution is better than 0.1° (in two directions), which corresponds to a k wave vector resolution from 0.002 to 0.01 Å-1, and the detector’s maximum energy resolution is 1.8 meV. The pass energy can be changed from 1 to 200 eV. The spectrometer operates in two angular modes ±3.5°, ±7°, ±15° (corresponding to acceptance cones of 7°, 14° and 30°). The charge-coupled device (CCD camera positioned behind the MCP signal amplifier with a diameter of 40 mm) observes 1000 angular channels and 1064 energy channels simultaneously.
The detector work function is 4.32 eV (data from 2025).
Spin Detector 3D VLEED
In the second half of 2023, the end station was upgraded with a 3D VLEED Ferrum spin-filter system equipped with Scienta-Omicron transfer optics. Unfortunately, due to a leak in the transfer optics chamber and problems with the aperture, the spin-filter system was only made available to users in September 2025. Between October 2024 and July 2025, the system was tested by beamline operators as well as by some users.

Figure 13. CAD model of the DA30L hemispherical detector with the 3D VLEED Ferrum spin filter system.
The installed pair of Ferrum VLEED spin detectors with Scienta-Omicron transfer optics enables the measurement of all components of the photoelectron spin. The VLEED (Very Low Energy Electron Diffraction) detector operates on the principle of spin-selective scattering of very low-energy electrons (~6 eV) from a magnetically ordered Fe(001)-p(1×1)-O surface. In spin-resolved photoemission measurements, electrons excited in the sample by UV radiation are directed onto a thin iron scattering layer with a defined magnetization. Because the scattering cross-section depends on the relative orientation of the electron spin with respect to the magnetization direction of the layer, the number of reflected electrons differs for spin “up” and spin “down.” Measuring the scattering intensity asymmetry (A) allows determination of the spin polarization components.

Figure 14. Operating principle of the VLEED detector. (Based on DOI: 10.1088/1361-648X/aa8f28).

Figure 15. Schematic of the photoelectron spin component measurement. It should be noted that the magnetic components are not identical to the Cartesian components of the manipulator.
The schematic and geometry of the photoelectron spin measurement using the two orthogonal branches (White and Black) of the VLEED spin filters are shown in Fig. 14 and Fig.15. The White detector measures the Sy and Sz components, while the Black detector measures the Sx and Sz components.
The advantages of this detector geometry combined with the 6-axis manipulator are as follows:
- Enables measurement of all spin components in any region of the Brillouin zone under normal-emission geometry.
- Allows a series of different measurements to be performed at a single sample position, such as spin-ARPES, CD-ARPES, and dispersion measurements along kzkz as a function of excitation energy.
- A simple and/or fixed excitation geometry facilitates the calculation of photoemission transition matrix elements.
- Allows for the “separation” of dichroic and spin effects.
- Facilitates the analysis of band symmetries.
- Enables measurements along high-symmetry directions without leaving the normal-emission geometry (via azimuthal rotation).

Figure 15. Neg-getter pump system connected to spin filters.
To ensure long target lifetimes and reduce the risk of chamber venting, a static NEG-Getter pumping system with shut-off valves was installed. NEG-Getter pumps (CapaciTorr Z 1000) are connected to the spin filters to reduce residual gases, particularly hydrogen. At room temperature, without cryopumping, the pressure in the chambers remains below 5.0×10⁻¹¹ mbar. NEG activation or target cleaning can be carried out using an auxiliary pumping station, without lowering the pressure in the main chamber.
Calibration parameters of the spin detectors (data from November 2024).
The basic parameters of spin filters (White and Black) such as the reflectivity, Sherman function, working point and the figure of merit (FOM) are summarized below. Calibration data were collected for the Au(111) surface state with a herringbone reconstruction, which is characterized by strong Rashba-type splitting.
Parameters of spin-filter targets:
| Black | White |
|---|---|
|
Reflectivity |
|
|
|
 |
|
Sherman function
|
|
 |
 |
|
The Working Point, defining the optimal scattering energy for the detector, is determined as the maximum of the Figure of Merit (FoM) of the scattering target, i.e.,
I₀ is constant. The measured I₀ from the second channeltron is not included in the plots below. |
|
 |
|


The presented calibration data come from the initial commissioning of the spin filters in November 2024 (new calibration data will be available around September–October 2025, as well as after each shutdown period and/or venting of the analysis chamber). The lifetime of the prepared thin iron oxide layer under UHV conditions (<<5×10⁻¹¹ mbar) is very long, i.e., no degradation of the targets was observed during a six-month measurement period. The targets are refreshed and re-validated before each user beamtime and/or after venting of the analysis chamber.
The energy resolution of spin-resolved measurements depends on the choice of aperture and Pass Energy, and is given by the formula:
∆E_VLEED [meV] = 2.42∙Pass Energy [eV]∙Aperture size [mm]

Figure 16. Fermi edge measurement for polycrystalline gold after passing through the analyzer and after scattering on a spin detector (Fe(111)/O target). Energy resolution for the following parameters: aperture 2 (0.5 mm x 1.0 mm), transition energy PE = 5 eV, entrance slit: 700 (800 µm), temperature 25K, exit slit of the photon beam 0.7 mm, excitation energy 20 eV; is ΔE = 12.1 meV.
Example spin-resolved data

Figure 17. Scattered photoelectron current for two different polarizations of the Fe(111)/O target. Measurement of a surface band with Rashba-type splitting on the Au(111) surface. The red and blue curves represent the photoelectron current scattered from the target for two opposite target polarizations (μ+ and μ-). The black graph is a function of signal asymmetry.
The asymmetry function is defined as:

Where I+ and I− denote the measured current of photoelectrons scattered from the oxidized iron layer. The spin polarization of electrons is proportional to the asymmetry function P=A/S, where S is the effective Sherman function that characterizes the scattering efficiency of the layer. On this basis, the partial intensities can be defined as:


Figure 18. The partial intensities N+, N-.
Spin-resolved maps:

Figure 19. Rashba-type splitting on the Au(111) surface state with spin resolution (Spin aperture: A3, entrance slit 700; exit slit= 0.9mm, thetaY=0; thetaX (-5.2,5.2), PE=10 eV).
Total resolution
The overall measurement resolution is influenced by the beamline resolution (monochromator resolution, exit slit size, diffraction limit, source size, ...), detector resolution, thermal broadening, the accuracy of temperature determination...

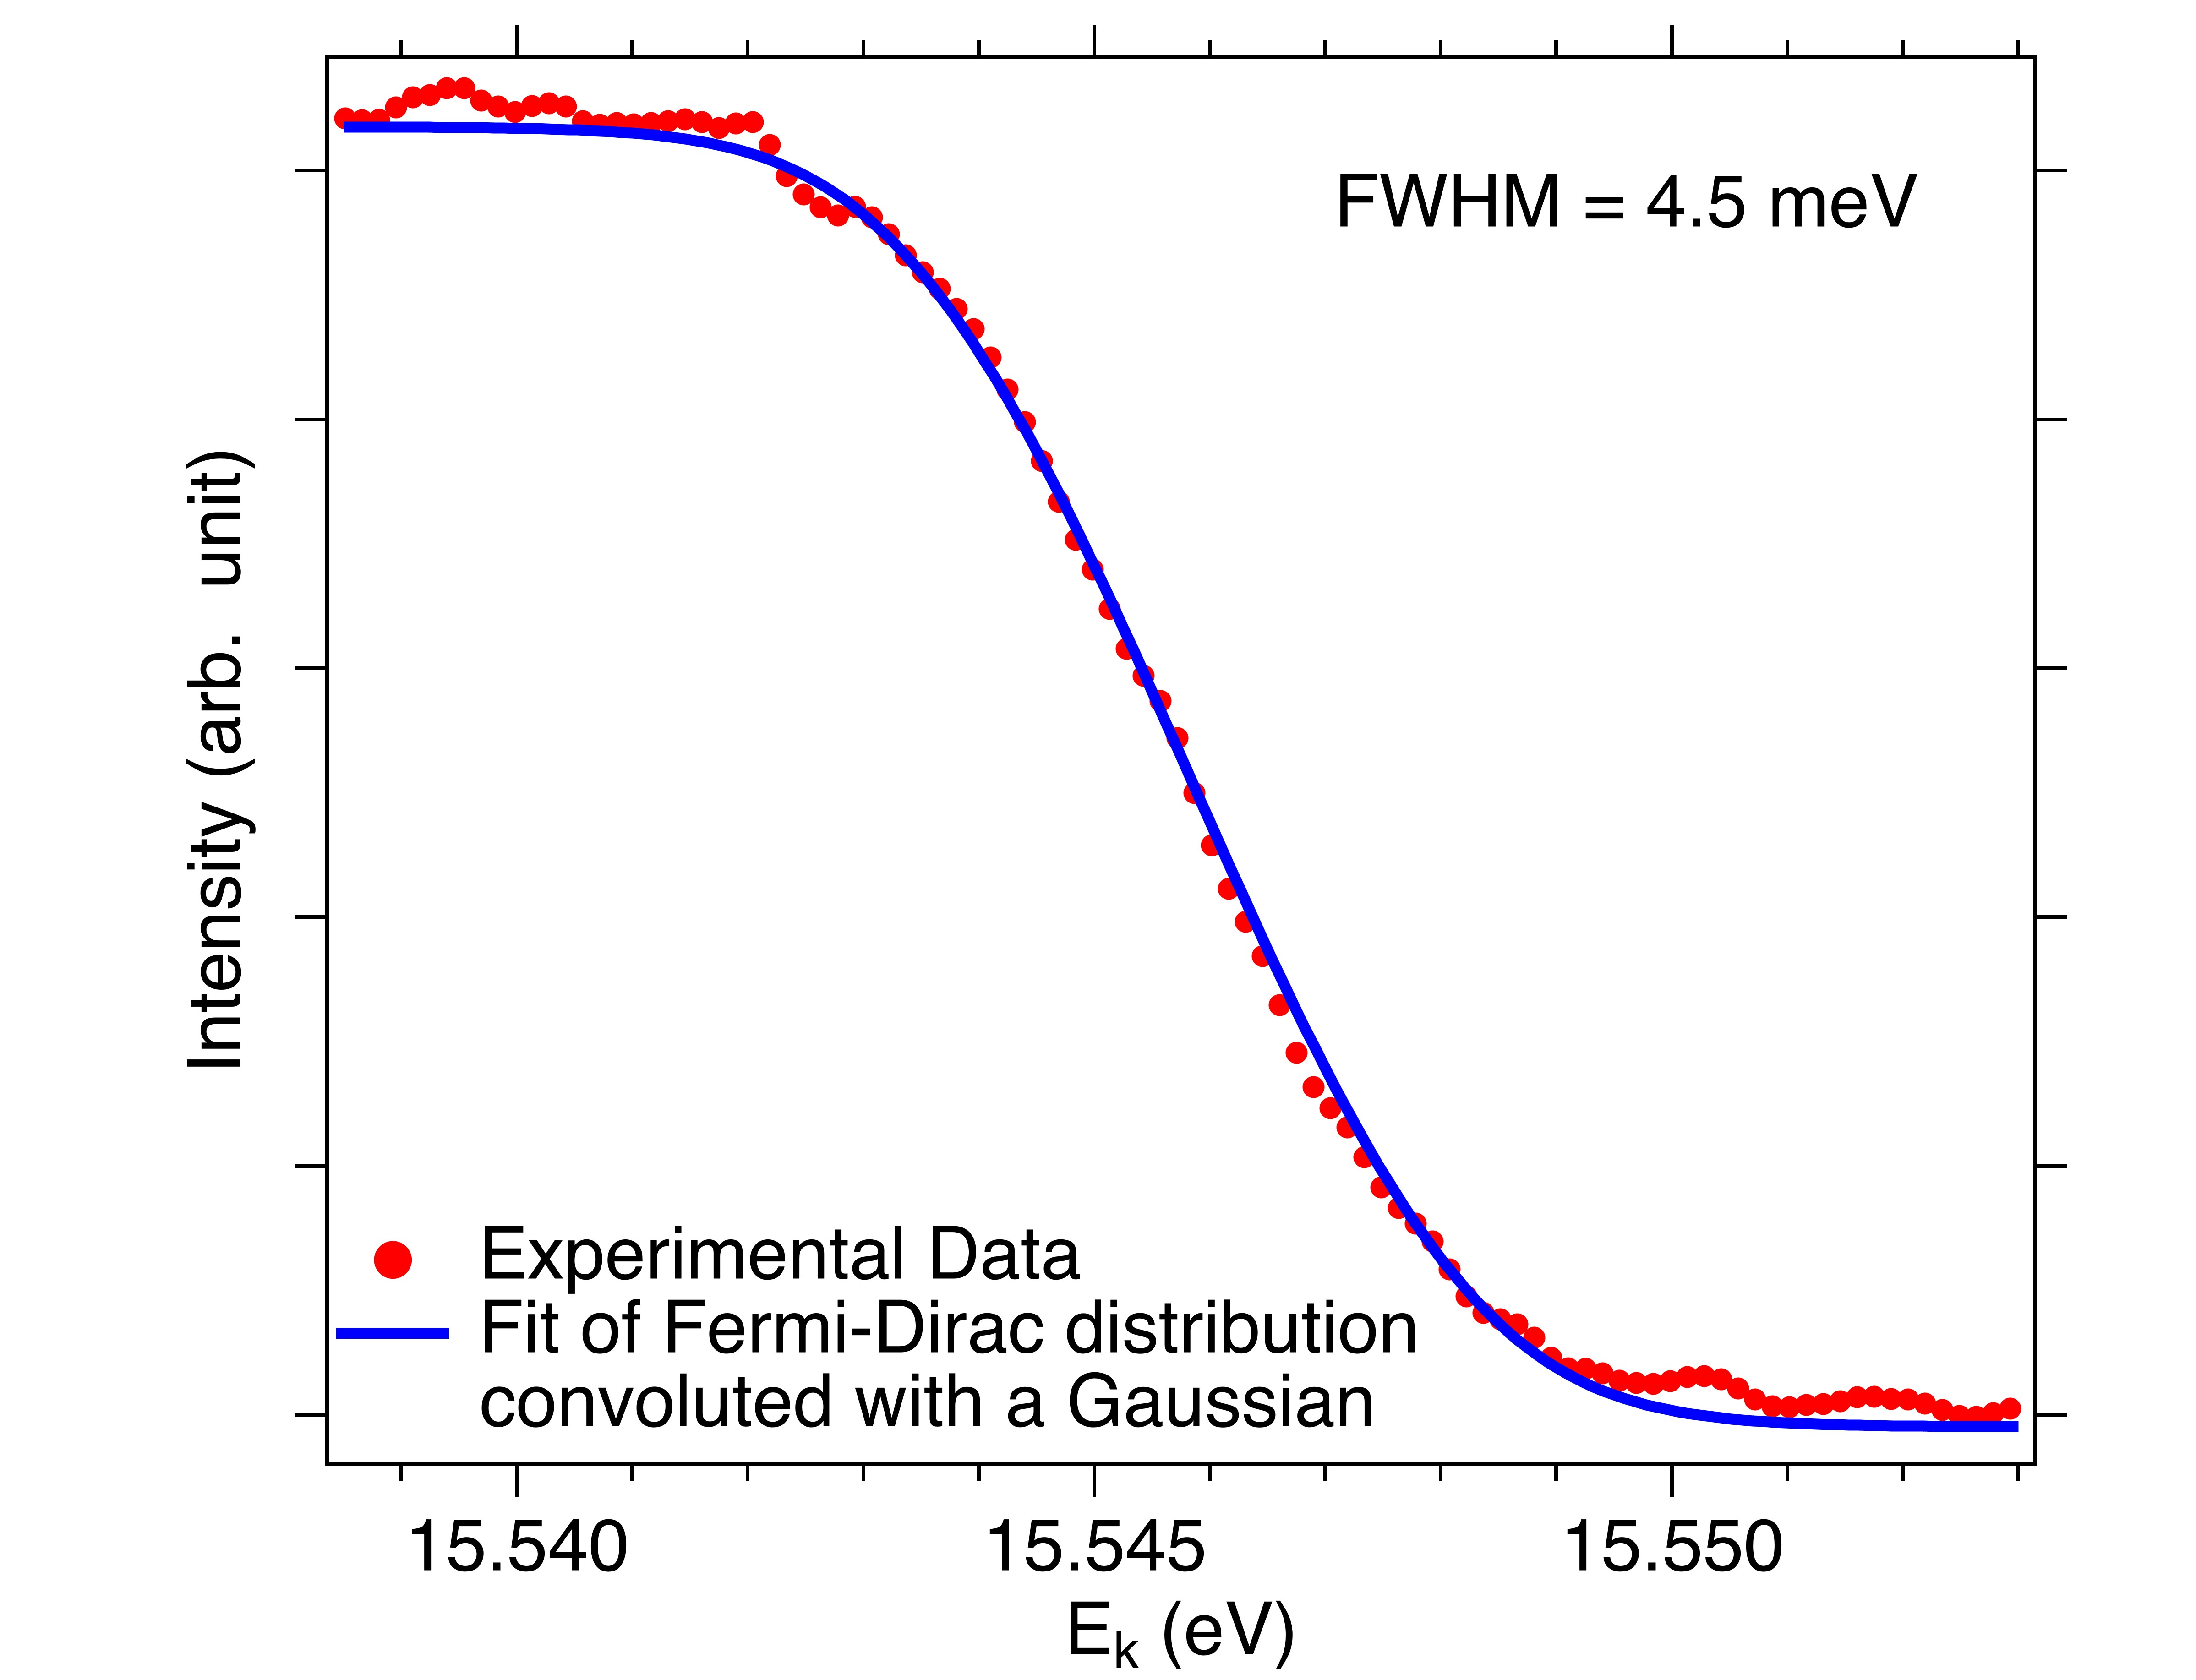
Figure 20. Fitting the convolution of the Fermi and Gaussian functions to the Fermi step measured on polycrystalline gold at 8 K for 20 eV energy in PGM mode. The obtained FWHM value of the Gaussian function determines the total resolution of the beamline and the end station at 8 K temperature (4kT=2.8 meV). The pass energy was 2 eV, which gives a guaranteed resolution of 1.8 meV, the detector entrance slit was 200 (0.2 mm), and the beamline exit slit gap was 25 µm.
Automation
The URANOS beamline is largely motorized and automated. During the measurements, the user uses the SES software from Scienta-Omicron, which is communicated with the beamline software (Energy Configurator) and the end station (Manipulator). The measurement process is considerably automated, and the beamline control system is simplified and centralized. Therefore, remote measurements of samples that do not require specialized preparation are possible.
The Energy Configurator is a program that allows to control the beamline: opening and closing the shutters, setting the energy, light polarization or the gap of the exit slit. During the change energy of photonbeam, the undulator gap changes automatically for a given polarization. The PID (proportional-integral-derivative) controller minimizes the current difference measured at the horizontal right and left exit slits by changing the position of the focusing mirror in order to automatic location and centering of the photonbeam.
The energy configurator is connected with the SES data acquisition program and consequently enables automatic control of the excitation energy set from the SES program.
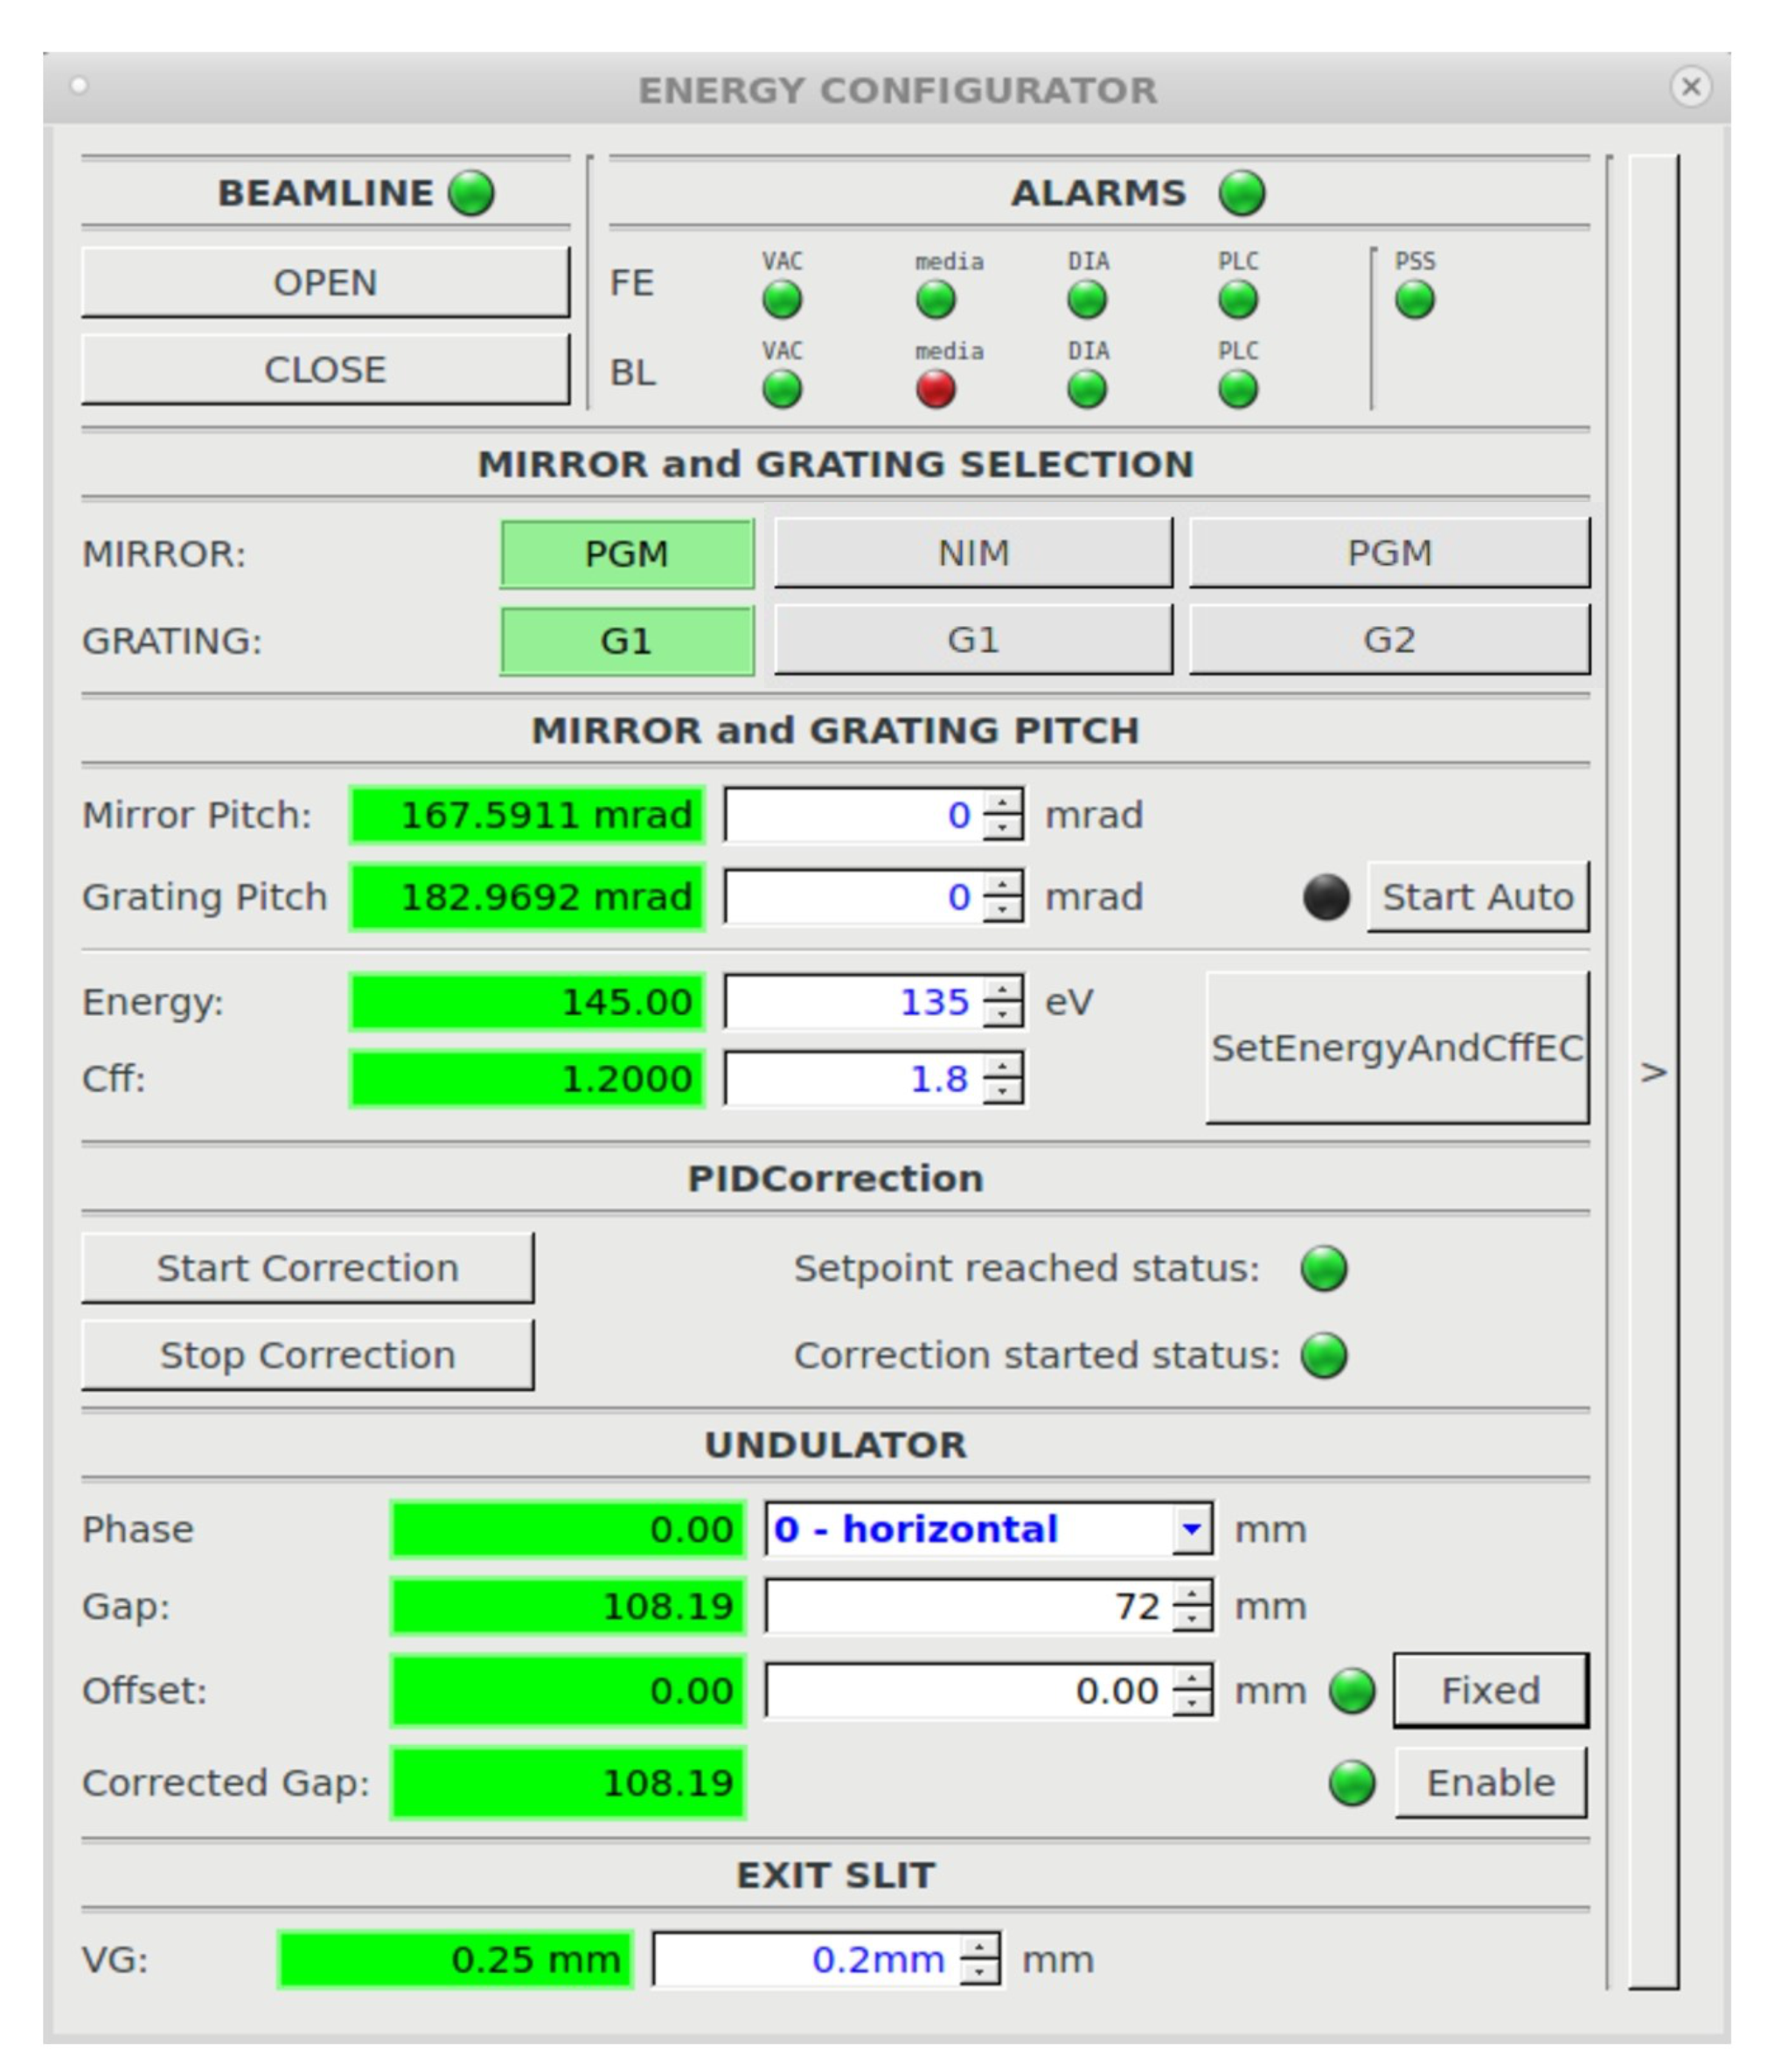
Figure 21. Energy configurator panel that allows setting the energy of the photons, polarization, gap of exit slits, and cff optimization. The program automatically selects other beamline parameters.
Data analysis
For data analysis, dedicated and specialized macros in Igor Pro are used, enabling quick preview and processing of the collected measurement data. The macros allow spectra to be transformed into momentum space, normalized, cropped, and properly visualized by adjusting the color scale, along with a range of other operations necessary for correct interpretation of ARPES data. Thanks to the graphical interface, working with experimental results is intuitive and does not require the user to be familiar with advanced Igor Pro functions.


Samples preparation
The analytical chamber is connected to the preparation chamber, where the base pressure is 1×10⁻¹⁰ mbar. In this system, samples can be prepared in situ by various methods: e.g. by bombarding its surface with argon ions, heating up to 2000 K or cooling to 100 K, deposition of epitaxial layers, surface reactions in the gas phase, or another after beamline staff approval. In the preparation chamber, there are 3 ports for quick connecting of user devices such as effusion cells, EBV, cracker, etc. without losing the ultra-high vacuum in the chamber. There is also a port where a vacuum suitcase can be installed. The sample preparation process can be monitored using a LEED diffractometer with Auger spectroscopy, a residual gas analyzer (RGA), and quartz microbalance. Crystalline samples can be cleaved immediately prior to measurement in ultrahigh vacuum at room temperature or cryogenic temperatures. Soft thin films or van der Waals materials can be exfoliated under vacuum in the load lock chamber. It is possible to connect an AMD-type alkali metal source (Ce, K, Na, Ru, Li)–SAES to the preparation chamber. Up to 6 sample holders can be loaded into the loading chamber at the same time.
All elements used for mounting the samples have to be nonmagnetic, e.g. from pure metals such as Mo, Ta, Ti, or Cu. The samples should be mounted on omicron or flag type holders complying with the following parameters:
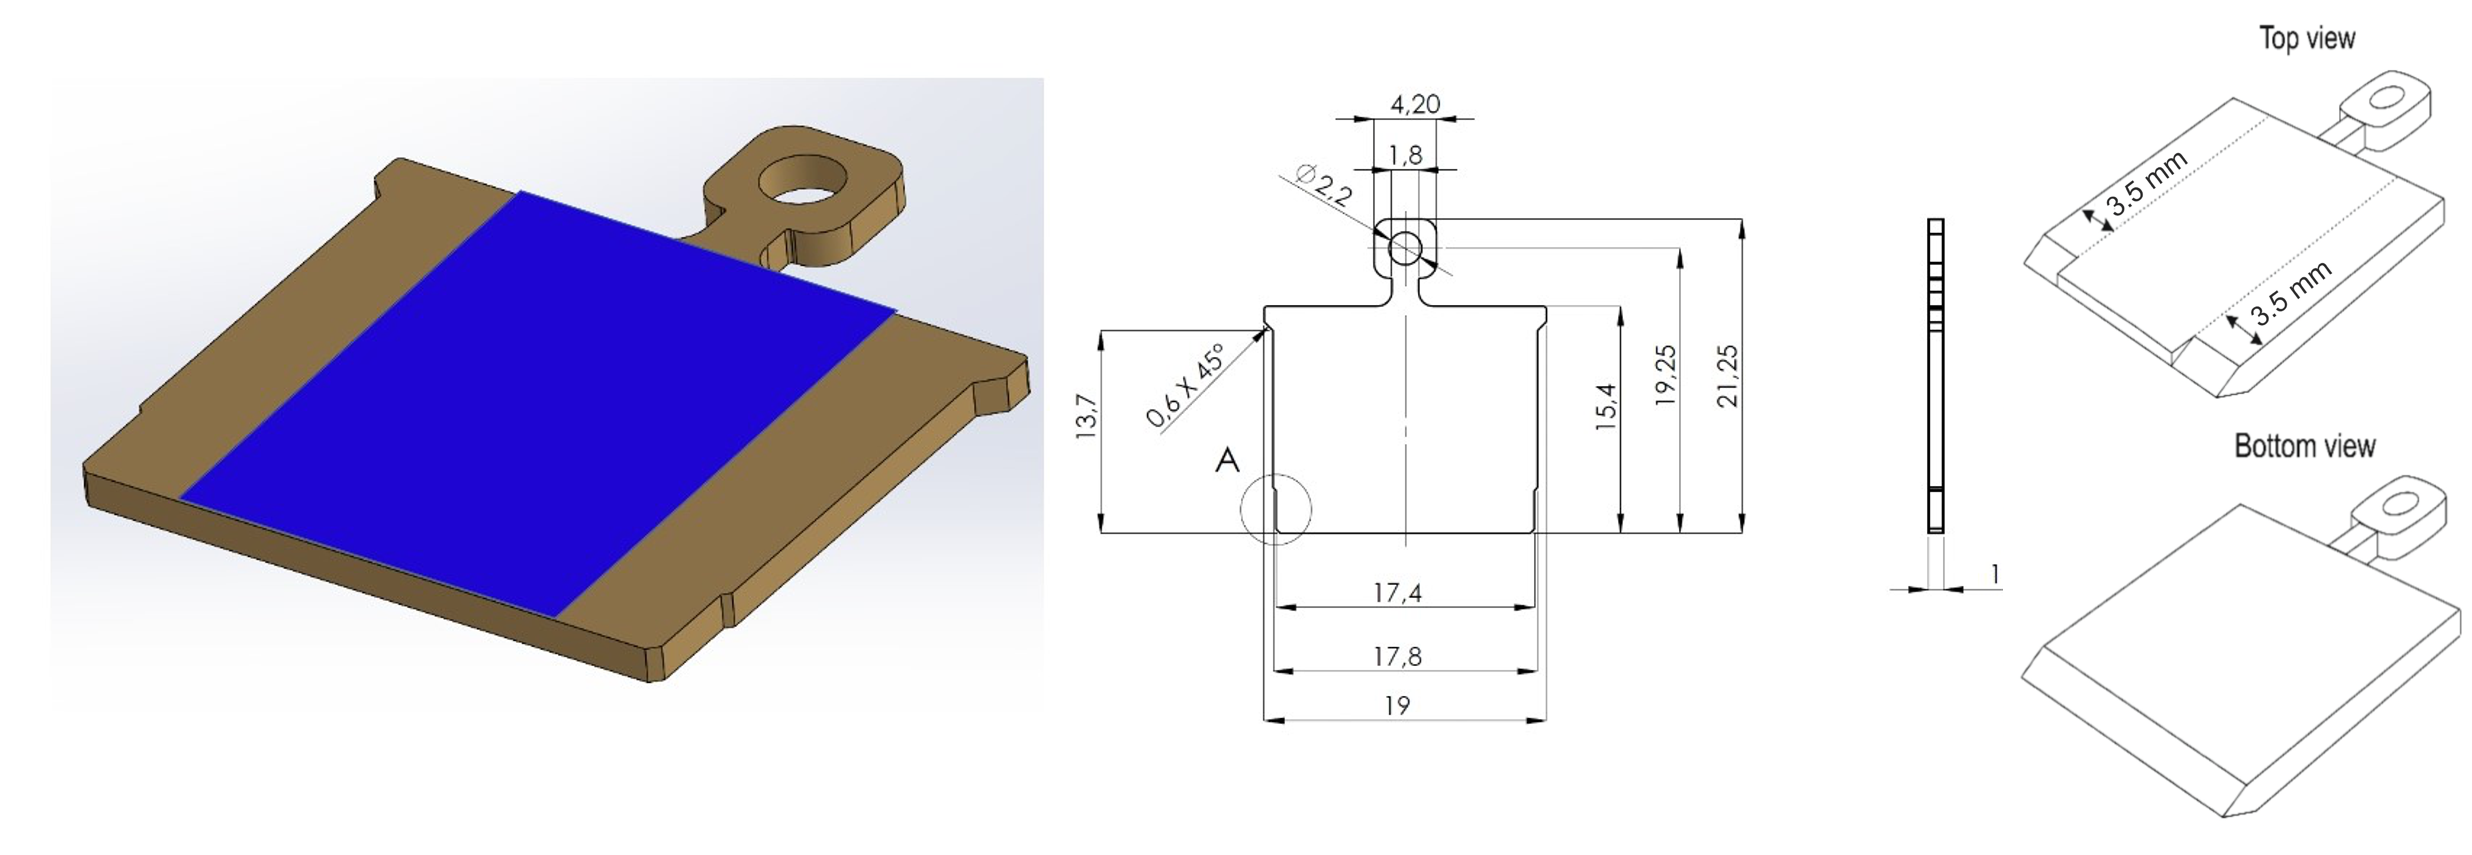
Figure 22. Sample holders
The blue area is the sample area. Required margins of 3.5 mm on each side.
To heat samples in the direct (electron beam) mode, the following holders should be used:
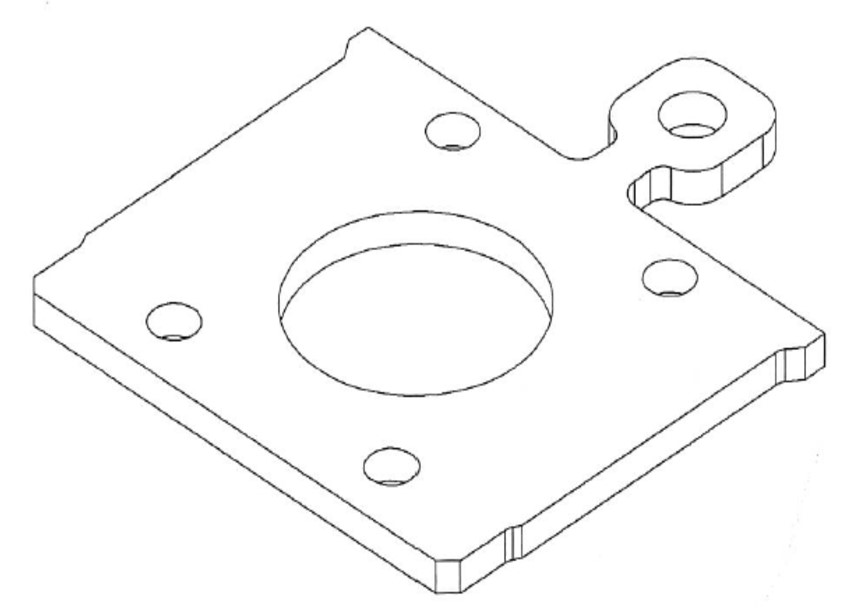
Figure 25. Sample holders to heat.